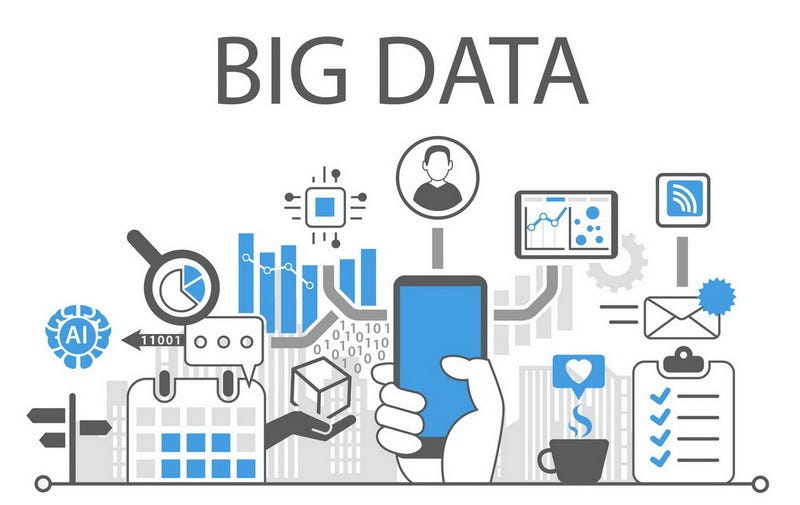
Big data is a term that describes datasets that are too large to be processed with the help of conventional tools and also is sometimes used to call a field of study that concerns those datasets. In this post, we will talk about the benefits of big data and how businesses can use it to succeed.
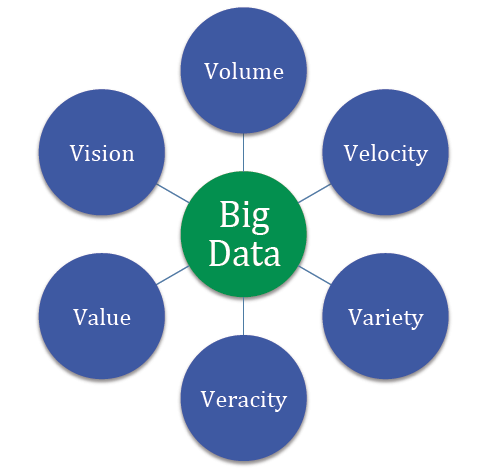
Big data is often described with the help of six Vs. They allow us to better understand the nature of big data.
As it follows from the name, big data is used to refer to enormous amounts of information. We are talking about not gigabytes but terabytes ( 1,099,511,627,776 bytes) and petabytes (1,125,899,906,842,624 bytes) of data.
Velocity means that big data should be processed fast, in a stream-like manner because it just keeps coming. For example, a single Jet engine generates more than 10 terabytes of data in 30 minutes of flight time. Now imagine how much data you would have to collect to research one small aero company. Data never stops growing, and every new day you have more information to process than yesterday. This is why working with big data is so complicated.
Big data is usually not homogeneous. For example, the data of an enterprise consists of its emails, documentation, support tickets, images, and photos, transaction records, etc. In order to derive any insights from this data, you need to classify and organize it first.
The meaning that you extract from data using special tools must bring real value by serving a specific goal, be it improving customer experience or increasing sales. For example, data that can be used to analyze consumer behavior is valuable for your company because you can use the research results to make individualized offers.
Veracity describes whether the data can be trusted. Hygiene of data in analytics is important because otherwise, you cannot guarantee the accuracy of your results.
Variability describes how fast and to what extent data under investigation is changing. This parameter is important because even small deviations in data can affect the results. If the variability is high, you will have to constantly check whether your conclusions are still valid.
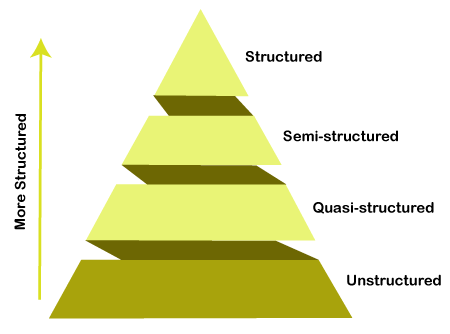
Data analysts work with different types of big data:
- Structured. If your data is structured, it means that it is already organized and convenient to work with. An example is data in Excel or SQL databases that is tagged in a standardized format and can be easily sorted, updated, and extracted.
- Unstructured. Unstructured data does not have any pre-defined order. Google search results are an example of what unstructured data can look like: articles, e-books, videos, and images.
- Semi-structured. Semi-structured data has been pre-processed but it doesn’t look like a ‘normal’ SQL database. It can contain some tags, such as data formats. JSON or XML files are examples of semi-structured data. Some tools for data analytics can work with them.
- Quasi-structured. It is something in between unstructured and semi-structured data. An example is textual content with erratic data formats such as the information about what web pages a user visited and in what order.

Big data analytics allows you to look deeper into things.
Very often, important decisions in politics, production, or management are made based on personal opinions or unconfirmed facts. By analyzing data, you get objective insights into how things really are.
For example, big data analytics is now more and more widely used for rating employees for HR purposes. Imagine you want to make one of the managers a vice-president, but don’t know which to choose. Data analytics algorithms can analyze hundreds of parameters, such as when they start and finish their workday, what apps they use during the day, etc., to help you make this decision.
Big data analytics helps you to optimize your resources, perform better risk management, and be data-driven when setting business goals.

Understanding big data is challenging. It seems that its possibilities are limitless, and, indeed, we have many great solutions that rely heavily on big data. A few of those are recommender systems on Netflix, YouTube, or Spotify that all of us know and love (or hate?). Often, we may not like their recommendations, but, in many cases, they are valuable.
Now let’s think about AI-systems that predict criminal behavior. They analyze profiles of criminals and regular people and can tell whether a person is likely at some point to commit a crime. These algorithms are reported to be quite effective.
However, their predictions are not as effective as to give them legal power, mostly because of the bias: algorithms are prone to make sexist or racist assumptions if the data is racist or sexist. You have probably heard about the first beauty contest judged by AI. None of the winners were black, probably, because the algorithm wasn’t trained on photos of black people. A similar fail happened with Google Photos that tagged two African-Americans as ‘gorillas’ ― for the same reason. This demonstrates how important the gender-race sensitivity perspective is when choosing data for analysis. We should improve not only the technology but also our way of thinking before we can create technologies that effectively ‘judge’ people.
If you want to benefit from the usage of big data, follow these steps:
First, you need to set up a strategy. That means you need to identify what you want to achieve, for example, provide a better customer experience, improve sales, or improve your marketing strategy by learning more about the behavioral patterns of your clients. Your goal will define the tools and data you will use for your research.
Let’s say you want to study opinion polarity and brand awareness of your company. For that, you will conduct social analytics and process raw unstructured data from various social media and/or review websites like Facebook, Twitter, and Instagram. This type of analytics allows assessing brand awareness, measuring engagement, and seeing how word-of-mouth works for you.
In order to make the most out of your research, it is a good idea to assess the state of your company before analyzing. For example, you can collect the assumptions about your marketing strategy in social media and stats from different tools so that you can compare them with the results of your data-driven research and make conclusions.
Once you have identified your goals and data sources, it is time to collect and analyze data. Very often, you have to preprocess it first so that machine learning algorithms could understand it.
By applying textual analysis, cluster analysis, predictive analytics, and other methods of data mining, you can extract valuable insights from the data.
Use what you have learned about your business or another area of study in practice. The data-driven approach is already adopted by many countries all around the world. Insights taken from data allow you to not miss important opportunities and manage your resources with maximum efficiency.

Let us now see how big data is used to benefit real companies.
When you develop a new product, you can trust your guts or rely on statistics and numbers. P&G chose the second option and spends more than two billion dollars every year on R&D. They utilize big data as a springboard for new ideas. For example, they aggregate and filter external data, such as comments and news mentions, using Bayesian analysis on P&G’s product and brand data in real-time to develop new products and improve existing ones.
Even a minor mistake or failure in the oil and gas industry can be lethal and cost millions of dollars. Predictive maintenance with the help of big data includes vibration analysis, oil analysis, and equipment observation. One of the providers of such software is Oracle. Their machine learning algorithms can analyze and optimize the use of high-value machinery that manufactures, transports, generates, or refines products.
Digitalization of financial operations can prevent credit card theft, money laundering, and other such crimes. The USA Internal Revenue Service is one of the institutions that rely on processing massive amounts of transactions with the help of big data analytics to uncover fraudulent activities. They use neural network models with more than 600 different variables to be able to detect suspicious activities.
Big data is the technology that will continue to grow and develop. If you want to learn more about big data, machine learning, and artificial intelligence in research and business, follow us on Twitter and Medium and continue reading our blog.