Finest Diagrams Explicitly Demonstrating Product Management Concepts

Introduction to Product Management | Infinity

There are a lot of things product managers are accountable and responsible for. A product manager is not only liable to strategize by creating a roadmap but also needs to articulate the release cycle of a new product to the team along with everything that comes in between.

They are also required to have the expertise in knowing how to identify the priority tasks and manage the team accordingly. Not just this, but mobile product managers are also given the responsibility to analyze the features added to a product (mobile app) and whether they are in sync with the client’s goals.

All in all, every process, activity, and decision associated with a product is synchronized and aligned by the mobile product manager. What helps these product managers achieve their KRAs is a certain set of skills.

Now, obviously they will be required to explain certain product management ideas to their team members so that they all are on the same page. But, the thing to wonder is – how do they explain all the product management concepts and key ideas?

Well, I think a few useful diagrams for product managers do the trick. If you are interested in knowing what these diagrams are and how and when they are used by mobile product managers, stick till the end.

Diagram 1 – Communication bottlenecks

Small Teams** Every Monday morning the CEO of our 5000 person company would send out an email starting with the words “Hello Team.” We all knew we were not One Team. ...complex product development is a collaborative activity that requires people ...

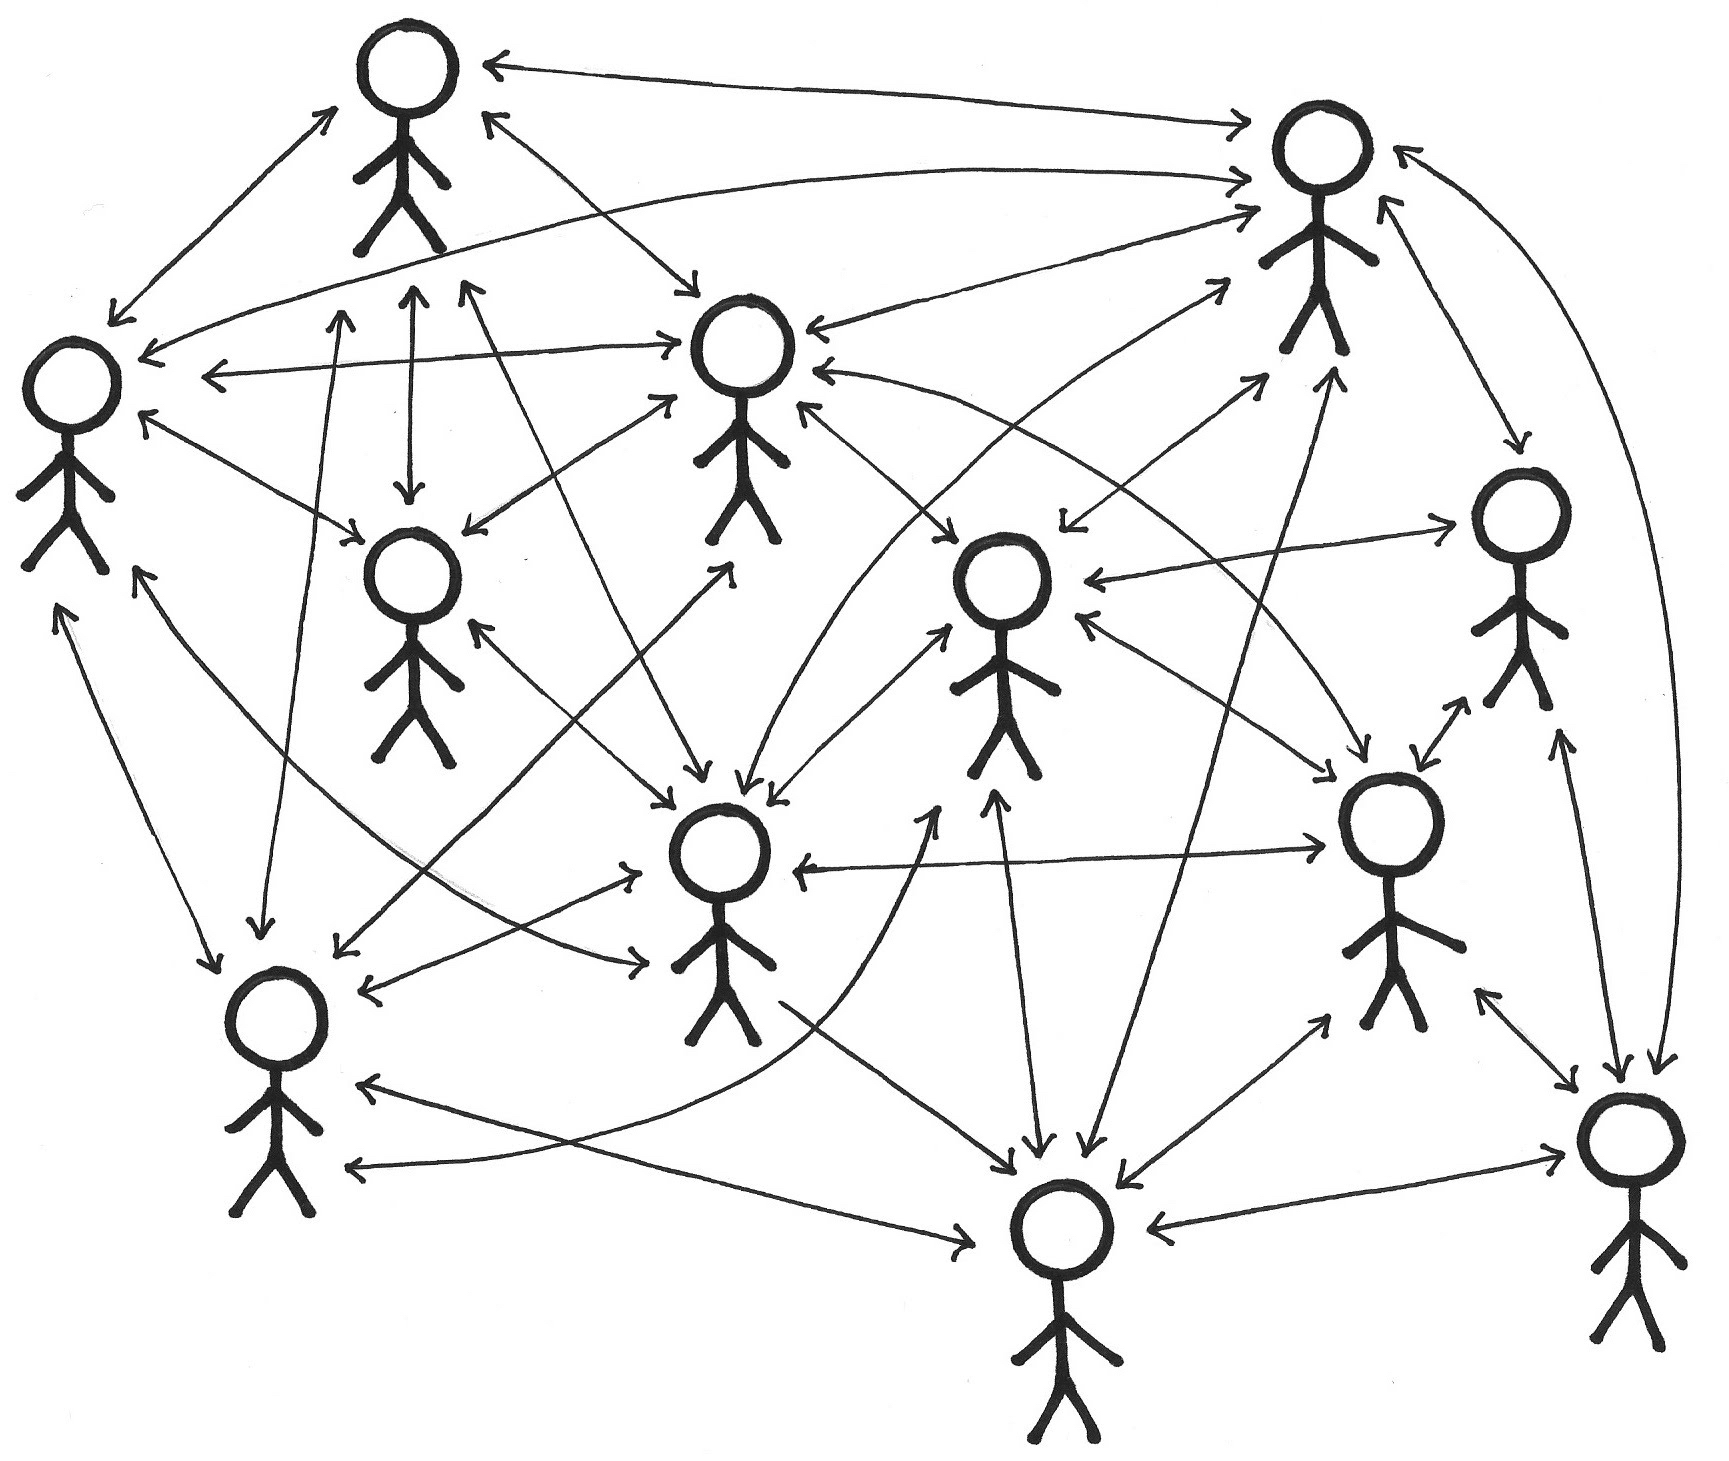
It is understood that as a manager, you need to be aware of what is going on in your team and how the team members are managing their tasks. But, it is ludicrous for any person to be involved in every communication and decision – one person cannot handle all the things on one’s own, right? Isn’t this why the delegation was invented?

Now, it is natural you would want to be included in all the important inter/intra-team conversations, but you need to reflect on one thing – is it necessary? Is it something you should do by putting aside your other responsibilities?

The answer is – analyze whether the team is capable of communication which is not dependent on you. And if it is, you need to make some conscious decisions to ensure that important things like fluent communication are not solely dependent on you. A diagram that can effectively explain the case in point is given below.

Let’s say, a Web Engineer needs to discuss something with the Product Analyst and then the PA says they need to discuss something with the iOS developer in this regard. Now, the Web Engineer should ideally approach the PA and iOS developer directly, instead of being dependent on the PM (as shown in the image on the left).

The diagram on the left shows the dependency of the team on product manager to communicate with other members of other teams – something that adversely affects the workflow and slows it down. And on the right is the diagram displaying an efficient communication flow that is not dependent, instantly eliminating unnecessary points of contact.

Diagram 2: Waterfall vs agile

Moving From Waterfall To Agile With Kanban

Though there are many resources out there on the internet participating in the debate of the Agile vs Waterfall approach, it may still seem like a vague concept in relation to product management. So let’s clear the fog of ambiguity.

It is generally known that the cost of mobile app development is calculated on the basis of hours it takes to develop that product.

Now, if the product manager of that mobile app development company chooses to use the Waterfall approach (i.e., a large release of the product), this would mean that the product will be launched all in one go.

Now, when a product is released, it is expected to become an instant hit – something which won’t be easy in this instance, since the product is launched all at once and is definitely a home to some issues. The value that they will get from this release won’t be equivalent to the investment (time) made by the developers.  It is because they would require to fix the issues from the start.

On the contrary, the agile approach supporting small releases and iterations would show instant value results, since you are simultaneously identifying errors and fixing them.  The diagram above clearly shows the difference in the end result of choosing these product management approaches.

Diagram 3: Representation of delivery size

What we have learned going live with the Zimmo Prijswijzer | Rockestate

When it comes to delivering a product on time, it is a very crucial part of the whole development process. It can literally make or break the future of any mobile app. If time-to-market is too long, some other app could capture the market and it would render the mobile app in question futile.

Here is a representation of the sizes of initiatives taken when developing an application –

The diagram on the left shows the throughput of the delivery size that only deals with working on big projects (large chunks of work at the same time). It is absolutely clear that working only on big projects of a product would create a blockage at one point of time in the future, since these projects would require more time, attention, resources, etc. And if anything goes wrong, the impact would be devastating on the whole process, inevitably increasing the time-to-market.

{Also read our article on “Project Managers vs Product Managers: Difference, roles & challenges”}

The diagram on the right is a classic “to do”. The advantages of adopting the Agile approach have rippled down to this stage in the product management process as well. This approach advocates the mixture of performing small tasks with large chunks of work (blue), something that we also follow at Anteelo.

As visible in the diagram, unlike the one on the left, here small chunks of work (Pink) can easily pass through the funnel (can be done easily). If these prove successful, the product managers can carry on with this idea (yellow circles) and invest completely. And if otherwise is the case, then they can iterate again and invest accordingly.

{Check out this extensively detailed article on “10 most important documents product managers must prepare”}

Diagram 4: Level of leadership involvement

Level of leadership involvement

The diagram below comprises two models for elaborating this product management concept. One on the left displaying the initiative size, number of tasks done at a time, and the risk factor in them, and the other concerned with the level of involvement of the product managers (leadership) correspondent to these tasks and initiatives.

The one on the left is a pyramid of tasks/initiatives to be performed by the team. The bottom of the pyramid means many tasks being performed at once, and the diagram on the right shows the amount of involvement with respect to these menial tasks having low to none risk.

As we move to the top of the pyramid, the number of tasks decreases while the risks associated with these tasks increase as well, this is where the product manager MUST be consulted, while in the formed he/she can be just informed. This diagram would help not just help mobile product managers but also the team members in knowing when to depend on the leadership.

Diagram 5: Analyzing segmentation value

How to automatically segment customers using purchase data and a few lines of Python | by Tristan Ganry | Towards Data Science

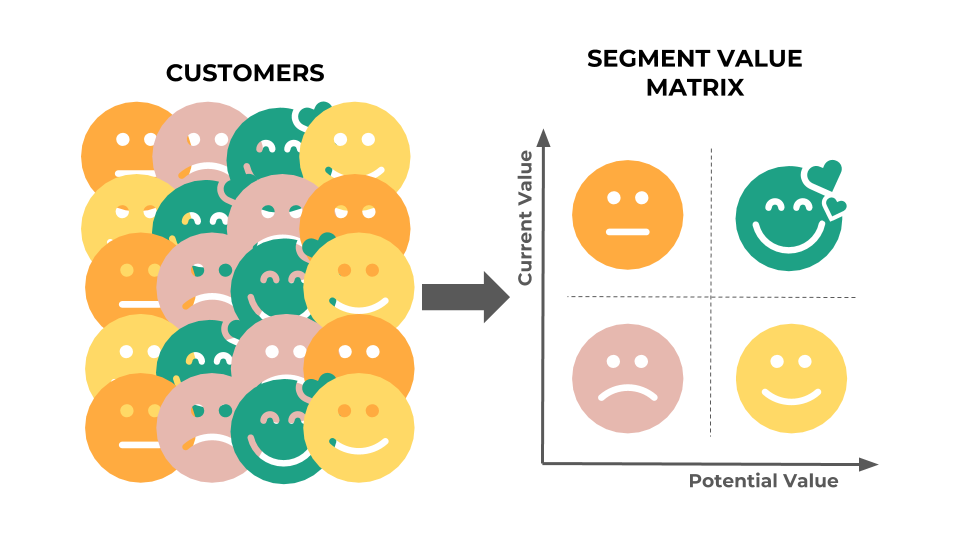
There are a few practices that organizations are accustomed to following. One of them being the habit of optimizing for the average instead of a segment. Meaning, they tend to focus on the average instead of particular segments that need improving.

In the circumstances where the targets and hypotheses are fairly broad, it becomes challenging for the product managers and development teams to create an impact via product. It is because you are here trying to satisfy a variety of targets at the same time, which is not at all possible.

Diagrams, such as given below are a way to analyze each segment for identifying which ones are impacting the performance of others. All this to resolve the prevailing issues.

The diagram above consists of three hypothetical experiments 1,2, and 3 with segments A, B, C, and D. Out of three experiments, in the first case, there was an uplift in the segment A, followed by a decrease in the second case, and third with no change.

Taking an individual look, in experiment 1, segment A performed well with others, except segment B. Now, the diagram has highlighted the decline in this segment juxtaposed to the others. This could help product managers in finding the reasons for this happening which will eventually improve the average in the longer run.

A similar situation occurs in experiment 3, where segments A, C, D underperform in opposition segment B which showed significant change. Again, a study would clear out the reasons for this happening.

These useful diagrams for product managers can easily be customized to one’s needs, irrespective of which industry the product managers are operating in. As far as  Anteelo is concerned, I think these models really help our teams in simplifying the process and maintain open communication between inter/intra-teams.

User Research Methods via Phases of Product Development

User research is one of the best ways to know what users want and how they interact with your product. It’s performed in order to improve the product as per the feedback gathered at different stages of product development. One of the mistakes that designers and PMs make is that they assume user research needs to be done only in the beginning. However, if you want to build a product that conforms to the needs of the user, research must be a continuous process. At the onset of the product development, user research is required to validate the idea. But when a product is out in the market, user research is needed to understand if users are liking it or not. It’s important to understand users’ needs and their pain points. It’s important to know how they interact and use your products/services, and what kind of challenges they experience while using them.

For this reason, different user research methods are used at different stages of product development. In this blog, I’ll talk about the research methods in detail. But first, let’s see the various stages of product development-

Discovery stage (from an idea to an MVP)

POC vs Prototype vs MVP: Which Strategy to Prefer?

Discovery stage starts with an idea. You have a picture in mind about what you want, and the problems you want to solve. But you need to validate your hypothesis.

You need to collect and analyze information about your end users, and their problem areas. You need to get an in-depth understanding of their goals, and challenges that might arise in implementation.

User research in this phase is required to validate those product ideas/hypotheses. When user research is done right, it helps in gathering valuable feedback on the ideas and saves precious time from building unwanted features.

Growth and maturity stage (from MVP to a full-fledged product)  

5 Phases of the Startup Lifecycle: Morgan Brown on What it Takes to Grow a Startup | by Lauren Bass | Tradecraft | Medium

The growth/maturity stage of the product is when the MVP is already launched in the market and people have already started using the product. The product/service has got enough traction and is on the verge of getting popular.

At this stage, user research is required to understand how users are interacting with the product– are they satisfied with the product, what more would they like to be included, how would they rate the product, where do they feel stuck while using the product, etc.

Good user research helps in iterating over the existing product to build new features, improve existing ones or remove unpopular features. It also helps in getting feedback on the existing features on the product.

Implementing user research in the discovery stage, one can visualize the real pain points of users and build a product that solves users’ problems.

In post-launch user research, one can see how users use a product and what are the gaps that prevent them from accomplishing their goals.

There are different user research methods for each stage. So, first, let’s see the whole spectrum of methods that are available.

A landscape of user research methods

User Research Methods: Gain Unfiltered Insights | Table XI

Nielsen Norman Group has conceptualized a variety of user research methods. I’ll be talking about the most common ones used by Product Managers/Design Leaders.

If you want to understand user’s attitude or what users say, then most common methods are-

Surveys :- They consist of a series of questions which give you quantitative information from a large sample set.  It can be used for both validating a hypothesis or gathering feedback from users. Therefore, surveys can be used in both discovery and post launch stages.

User interviews:- They are one-on-one discussions with users to gather qualitative information. Interviews are usually conducted in a small sample set.

They can be used in various ways – exploration to discover the pain points of the users, discovering new ideas for products/features, to test a hypothesis or to know the likes or dislikes of a user.

User interviews can also be used in both discovery and post launch stages.

Contextual inquiries:- In these sessions, users are observed as they perform tasks in their natural environment. This is a method to gather first hand information from the users. In other methods, you only listen as the user tells how he/she performs a certain task. In this, you can observe the user doing these tasks.

This method can also be used in both discovery and post launch stages.

In the discovery phase, one can observe the end users of the product in their environment while they work. This could give insights on what is repetitive in nature and how technology can remove those brainless iterations.

In the post launch stage, we can observe the end user using the MVP and observe where users get stuck or what are the blockers for them. Is there something which is manual and can be easily automated to make users’ life easy?

User feedback:- In user feedback, users give their opinion on the product. This is typically gathered through a link, feedback form, recommend button, etc. One example of gathering user feedback is through Net Promoter Score (NPS) which is a form of user feedback used to know whether a user would want to recommend the product to others.

This is done in the post launch stage of the product in order to improve the existing features.

All of the above methods help build empathy with the users and understand their attitude, likes/dislikes towards product usage.

If you want to understand what people do or how people use your product (also called as usability of the product), then most common research methods are-

A/B Testing :- It’s a quantitative method that allows you to compare two versions of a product and figure out which one works better. It’s used in making incremental changes in a product. There are tools available that allow you to run 2 versions of the same thing. 50% of the users will see one version and another 50% will see another version. Therefore, with A/B testing you could experiment with headlines, button texts or two layouts of the same page.

A/B testing can be used only in the post launch stage of the product.

Eye tracking/Heat maps:- Heat maps allow you to evaluate which sections of the website or app users engage with the most. There are many tools available that allow you to track how users engage with a hyperlink, button, or in what pattern they read the content. This kind of study is very critical to understand what users really care about and what attracts their attention.

It can also be used for the post launch stage of the product.

A case study

Don't Waste More Time Writing Bad Case Studies. Use These Tips Instead. | TechnologyAdvice

To help you understand how research methods vary in different product development stages, let’s take an example of a hypothetical product.

We want to build a virtual mental-health helpline that would help people seek support for disorders like anxiety, depression, etc. This helpline is especially targeted for those who are bearing the brunt of the pandemic and are unable to go out and seek clinical help. Let’s call our hypothetical product –  “Lumos Solem”. (Lumos Solem is the incantation of a Harry Potter spell that produces a blinding flash of sunlight)

In the discovery stage

As a product owner/manager, we would first need answers to some basic questions to validate the idea.

  • Would users be comfortable in using SMS/video to share their problems?
  • How comfortable would the users be in a virtual setup?
  • Who would be my target audience? What age, demographics?
  • What are the most common mental health problems that the helpline would address?
  • Should we get experts on onboard? Who would talk to the people seeking help?
  • Would people get a choice on who they want to talk to? Or will there be an automatic redirection to the first available person?

At this stage the user research methods that one can use to get answers to above questions can be–

  1. Surveys
  2. Interviews

For conducting the survey–

  1. Define the objective of the survey
    • In our case, it could be “To understand the user behaviour towards a virtual mental health platform”
  2. Identify the target audience and the sample size you need
    • In our case, an example of the target audience could be the most vulnerable  age group – 30- 80 age group and living in metro cities. Sample size can be a mix of middle aged and senior citizens.
  3. Frame the questions in an open and non-leading manner to gather the maximum insights without bias. Questions for Lumos Solem could be –
    • What does mental and emotional health mean to you in your everyday dialogue?
    • Do you feel the urge to talk to someone and just blurt things out to lighten your head? If yes, then what kind of communication could help you in expressing your thoughts?
    • What kind of answers do you seek in your daily routine which affects your mental or emotional wellbeing?Make the answers as multi-choice so that analysis is easier.

After that carry out the survey using any available tool like Google Forms and analyze the data to derive insights. This will help validate the hypothesis we assumed.

For interviews, follow the same steps as above. The only difference here would be to make a rough script, inform the participants the purpose of the discussion.

In growth and maturity stage

Let’s suppose Lumos Solem is in the market and we’ve started getting our innovators & early adopters on the platform.

Now it’s the time to build/remove features and collect analytical data using usability tests. In the post-MVP stage you can ask questions like-

  1. Analytics shows that users are dropping at the onboarding. Why?
  2. Those users who get past user-onboarding, drop off at the payment link. What can we do to retain them?

Product Life Cycles | Boundless Marketing

The user research methods that one can use to get answers to above questions can be–

Feedback form:- Feedback form after every virtual session can help you collect useful information about the quality of interaction. It can be for both mental-health experts as well as the users. This will give users a chance to share what they like or dislike about the service. You are also likely to discover blind spots like technical glitches hampering the quality of conversations, etc.

A/B testing:- If consultation with health experts is paid, you can experiment with the wording of the payment link. The idea is to make users trust in the process. If users are dropping off at the payment link, then you can A/B test the features of Pay now/Pay Later and see if they stay when given an option to pay later.

Heatmaps:- Heatmaps can be used to see what common problems people look for in FAQs. The area where heatmap is densely colored will indicate that users are most interested in reading about a particular topic. This data will help you refine your features so that users can find it easier to accomplish their tasks.

User interviews:- Conducting 1:1 user interviews with experts and users can also help in understanding the problems they are facing in a virtual helpline. At times, people hesitate in sharing their opinion in written format but are more vocal about sharing it in person. In such cases, user interviews come handy.


To conclude,  each user research method has its advantages and disadvantages. The choice of the method will be based on the nature of the product, stage of the product, the users and the answers you’re looking for.

There is a difference between what users say/think and what users do. If you want to know what users say then surveys, interviews and contextual inquiries are suitable to get the information. But if you want to know what users actually do then methods like A/B testing and heat maps are helpful.

I hope I was able to pass on some clarity of which methods to use during a particular product development stage.

Software Metrics for your Product Development

Developing a quality software product falls under the realm of software engineering. The ever changing user requirements and harsh project timelines pave way for cost overruns or delays in the delivery schedule. So, bigger the scope of your project, more complex the functionality becomes. With so many factors it is very easy to lose control over the quality processes to develop an excellent product. We know that no engineering is complete without accurate measurements; which further brings us to the point that all measurements are done by applying certain metrics.For this reason we need software metrics for transparent and quality delivery of the product. Because when you measure what you speak about, you have numbers to express your failure or success. You have a calculated expression which shows you where you lacked and places you stood well. In Bob Parsons’ words-‘Anything that is measured and watched, improves.

Software Metrics to Improve Development: What and How to Track

Now the question arises- which software metrics to use?

One option is to pick a set of predefined metrics. The other one is you can first define the product requirements, discuss with the various stakeholders and then set the required metrics.

For a better understanding, consider an analogy when you are backpacking for an adventure activity. Would you pack a parachute if you are going for kayaking?


Absolutely not.


Instead, you would first decide upon the adventure sport, do a bit of research and accordingly pack your adventure gear. So, if you are going for paragliding, pack your bag with a helmet and a harness.

You can leave the oars behind for the next time.

Defying the law of gravity? It’s okay. But make sure you don’t cause more harm than good in the project. For this reason, it is important to apply the right metrics at the right stage in the product development cycle. As a software development company which builds engaging products.

1. Team Velocity Points

In simple words, team velocity measures the average speed of your team towards achieving its goal during one sprint. The fact that a typical sprint goes on for about 2-4 weeks, calculation of team velocity points proves to be a valid metric to gather the team’s efficiency.

If you want to calculate your team’s velocity, sum up the story points that were completed during that Sprint. To decide the team’s velocity, a three sprint’s average is usually considered.

Why? It’s an industry standard and it determines the project’s pace at which the functionality is being developed. In simple terms, it tracks the velocity of a Scrum team over time. This metric helps in deciding whether the team can take up more work over time or is the team already overloaded and it need to be reduced.

2. Sprint Burndown

What is Burndown Chart in Scrum?

Sprint burndown chart is the most effective tracking metric to visualize the health of the project. It helps in reviewing how much work is pending and if the team needs to speed up or slow down. You can also predict the expected completion date of the sprint. A deviation from the expected burndown will send a red flag to the scrum master to take appropriate actions.

For instance, if burndown goes up at any point during the sprint, it reflects an addition to the existing scope. At this time, it’s important for a team to achieve ‘team’s goal’ first before fetching new items from the backlog.

Why? The Burndown chart indicates the progress of work within a sprint. It shows whether amount of work a team is accomplishing every day will lead to a successful sprint completion or not.

3. Release Burnup

How to Create a Release Burn-Up Chart — Rob Frohman

Product owners need to evaluate what should be out in the market first based on their discussions with other stakeholders. Release Burnup helps POs to continuously prioritize product backlog based on how the work is progressing.

If the release date is fixed and there has been a few additions to the initial scope, this is an important metric to align scope with the actual release date by either removing low priority backlog items or attempting to increase velocity by taking suitable measures.

Why? The Release Burnup chart indicates whether the sprints are progressing towards a successful project completion in terms of functionality achieved. Also, gives us a projected date of completion of the project.

4. Estimated Cost vs Actual Cost at Completion

Often there are gaps between the estimated cost projection during the start of the project and the actual cost at completion of the project. This metric gives a measurement of what deviations could have led to this difference in the cost.

Although, almost always the project cost goes higher than the expectation (just like we tend to overspend while shopping), this metric helps you understand what could be the possible cause of cost overrun- be it some design error or some changes in the scope of product development.

Why? Helps us understand what cost we had estimated and what cost was incurred. This helps us in improving our planning.

5. Number of major bugs per sprint

The number is an indicator of the overall quality of the product. When you are working in an agile project, it becomes important to put a budget i.e. count on the number of major defects open in a project at any point of time.

How can we stay within the budget? Reduce the count of defects reported.

How can we reduce the number of defects? Do Not Report!

Yes, I’m kidding.

Here is a better solution- focus at the time of planning, look-ahead and clearly define acceptance criteria before jumping on a sprint backlog item.

The priority of resolving any major bug is over and above implementing any new feature. Because if you can’t resolve what your did wrong, you can not pick a new feature.

At the same time, keep a close watch at the number of bugs reported after production release. If you have not been proactive in refactoring and improving quality of your code, chances are you will receive nasty numbers in this metric. This will help you to identify gaps in testing and take corrective measures

Product Development: User research methods

User research is one of the best ways to know what users want and how they interact with your product. It’s performed in order to improve the product as per the feedback gathered at different stages of product development.One of the mistakes that designers and PMs make is that they assume user research needs to be done only in the beginning. However, if you want to build a product that conforms to the needs of the user, research must be a continuous process. At the onset of the product development, user research is required to validate the idea. But when a product is out in the market, user research is needed to understand if users are liking it or not. It’s important to understand users’ needs and their pain points. It’s important to know how they interact and use your products/services, and what kind of challenges they experience while using them.Digital Product Development | Railsware Blog

For this reason, different user research methods are used at different stages of product development. In this blog, I’ll talk about the research methods in detail. But first, let’s see the various stages of product development


Discovery stage (from an idea to an MVP)

Discovery stage starts with an idea. You have a picture in mind about what you want, and the problems you want to solve. But you need to validate your hypothesis.

You need to collect and analyze information about your end users, and their problem areas. You need to get an in-depth understanding of their goals, and challenges that might arise in implementation.

User research in this phase is required to validate those product ideas/hypotheses. When user research is done right, it helps in gathering valuable feedback on the ideas and saves precious time from building unwanted features.

Growth and maturity stage (from MVP to a full-fledged product)  

The growth/maturity stage of the product is when the MVP is already launched in the market and people have already started using the product. The product/service has got enough traction and is on the verge of getting popular.

At this stage, user research is required to understand how users are interacting with the product– are they satisfied with the product, what more would they like to be included, how would they rate the product, where do they feel stuck while using the product, etc.

Good user research helps in iterating over the existing product to build new features, improve existing ones or remove unpopular features. It also helps in getting feedback on the existing features on the product.

Implementing user research in the discovery stage, one can visualize the real pain points of users and build a product that solves users’ problems.

In post-launch user research, one can see how users use a product and what are the gaps that prevent them from accomplishing their goals.

There are different user research methods for each stage. So, first, let’s see the whole spectrum of methods that are available.

A landscape of user research methods

Nielsen Norman Group has conceptualized a variety of user research methods. I’ll be talking about the most common ones used by Product Managers/Design Leaders.

If you want to understand user’s attitude or what users say, then most common methods are-

Surveys :- They consist of a series of questions which give you quantitative information from a large sample set.  It can be used for both validating a hypothesis or gathering feedback from users. Therefore, surveys can be used in both discovery and post launch stages.

User interviews:- They are one-on-one discussions with users to gather qualitative information. Interviews are usually conducted in a small sample set.

They can be used in various ways – exploration to discover the pain points of the users, discovering new ideas for products/features, to test a hypothesis or to know the likes or dislikes of a user.

User interviews can also be used in both discovery and post launch stages.

Contextual inquiries:- In these sessions, users are observed as they perform tasks in their natural environment. This is a method to gather first hand information from the users. In other methods, you only listen as the user tells how he/she performs a certain task. In this, you can observe the user doing these tasks.

This method can also be used in both discovery and post launch stages.

In the discovery phase, one can observe the end users of the product in their environment while they work. This could give insights on what is repetitive in nature and how technology can remove those brainless iterations.

In the post launch stage, we can observe the end user using the MVP and observe where users get stuck or what are the blockers for them. Is there something which is manual and can be easily automated to make users’ life easy?

User feedback:- In user feedback, users give their opinion on the product. This is typically gathered through a link, feedback form, recommend button, etc. One example of gathering user feedback is through Net Promoter Score (NPS) which is a form of user feedback used to know whether a user would want to recommend the product to others.

This is done in the post launch stage of the product in order to improve the existing features.

All of the above methods help build empathy with the users and understand their attitude, likes/dislikes towards product usage.

If you want to understand what people do or how people use your product (also called as usability of the product), then most common research methods are-

A/B Testing :- It’s a quantitative method that allows you to compare two versions of a product and figure out which one works better. It’s used in making incremental changes in a product. There are tools available that allow you to run 2 versions of the same thing. 50% of the users will see one version and another 50% will see another version. Therefore, with A/B testing you could experiment with headlines, button texts or two layouts of the same page.

A/B testing can be used only in the post launch stage of the product.

Eye tracking/Heat maps:- Heat maps allow you to evaluate which sections of the website or app users engage with the most. There are many tools available that allow you to track how users engage with a hyperlink, button, or in what pattern they read the content. This kind of study is very critical to understand what users really care about and what attracts their attention.

It can also be used for the post launch stage of the product.

A case study

To help you understand how research methods vary in different product development stages, let’s take an example of a hypothetical product.

We want to build a virtual mental-health helpline that would help people seek support for disorders like anxiety, depression, etc. This helpline is especially targeted for those who are bearing the brunt of the pandemic and are unable to go out and seek clinical help. Let’s call our hypothetical product –  “Lumos Solem”. (Lumos Solem is the incantation of a Harry Potter spell that produces a blinding flash of sunlight)

In the discovery stage

As a product owner/manager, we would first need answers to some basic questions to validate the idea.

  • Would users be comfortable in using SMS/video to share their problems?
  • How comfortable would the users be in a virtual setup?
  • Who would be my target audience? What age, demographics?
  • What are the most common mental health problems that the helpline would address?
  • Should we get experts on onboard? Who would talk to the people seeking help?
  • Would people get a choice on who they want to talk to? Or will there be an automatic redirection to the first available person?

Digital Product Development | Railsware Blog

At this stage the user research methods that one can use to get answers to above questions can be–

  1. Surveys
  2. Interviews

For conducting the survey–

  1. Define the objective of the survey
    • In our case, it could be “To understand the user behaviour towards a virtual mental health platform”
  2. Identify the target audience and the sample size you need
    • In our case, an example of the target audience could be the most vulnerable  age group – 30- 80 age group and living in metro cities. Sample size can be a mix of middle aged and senior citizens.
  3. Frame the questions in an open and non-leading manner to gather the maximum insights without bias. Questions for Lumos Solem could be –
    • What does mental and emotional health mean to you in your everyday dialogue?
    • Do you feel the urge to talk to someone and just blurt things out to lighten your head? If yes, then what kind of communication could help you in expressing your thoughts?
    • What kind of answers do you seek in your daily routine which affects your mental or emotional wellbeing?Make the answers as multi-choice so that analysis is easier.

After that carry out the survey using any available tool like Google Forms and analyze the data to derive insights. This will help validate the hypothesis we assumed.

For interviews, follow the same steps as above. The only difference here would be to make a rough script, inform the participants the purpose of the discussion.

In growth and maturity stage

Let’s suppose Lumos Solem is in the market and we’ve started getting our innovators & early adopters on the platform.

Now it’s the time to build/remove features and collect analytical data using usability tests. In the post-MVP stage you can ask questions like-

  1. Analytics shows that users are dropping at the onboarding. Why?
  2. Those users who get past user-onboarding, drop off at the payment link. What can we do to retain them?

The user research methods that one can use to get answers to above questions can be–

Feedback form:- Feedback form after every virtual session can help you collect useful information about the quality of interaction. It can be for both mental-health experts as well as the users. This will give users a chance to share what they like or dislike about the service. You are also likely to discover blind spots like technical glitches hampering the quality of conversations, etc.

A/B testing:- If consultation with health experts is paid, you can experiment with the wording of the payment link. The idea is to make users trust in the process. If users are dropping off at the payment link, then you can A/B test the features of Pay now/Pay Later and see if they stay when given an option to pay later.

Heatmaps:- Heatmaps can be used to see what common problems people look for in FAQs. The area where heatmap is densely colored will indicate that users are most interested in reading about a particular topic. This data will help you refine your features so that users can find it easier to accomplish their tasks.

User interviews:- Conducting 1:1 user interviews with experts and users can also help in understanding the problems they are facing in a virtual helpline. At times, people hesitate in sharing their opinion in written format but are more vocal about sharing it in person. In such cases, user interviews come handy.

To conclude,  each user research method has its advantages and disadvantages. The choice of the method will be based on the nature of the product, stage of the product, the users and the answers you’re looking for.

There is a difference between what users say/think and what users do. If you want to know what users say then surveys, interviews and contextual inquiries are suitable to get the information. But if you want to know what users actually do then methods like A/B testing and heat maps are helpful.

I hope I was able to pass on some clarity of which methods to use during a particular product development stage.


Why is remote software development expensive?

Why is remote software development expensive?
While we are speaking to our prospective clients about their product development plans, one comparison that often gets discussed is why they should even outsource to us and not hire an in-house team?While there are many other factors in comparing remote vs in-house software development, one of the important factors in this comparison is the overall cost.Though seasoned entrepreneurs may understand this very well, as a first-time entrepreneur, it’s easy to miss out that when you are hiring a company for your software development, you’re paying for a finished product.

And a “finished product” is a lot more than the code that gets pushed on your servers. Here’s what all goes into building successful software:

  1. Team salaries: The salaries paid to the team working on your product is the most obvious expense and hence this is the first item on this list. Duh!
  2. Office space: A clean, well maintained IT office at an accessible location with all amenities including Internet connectivity, meeting rooms, projectors, whiteboards, pantry, etc. is a constantly recurring cost borne by the company.
  3. Hardware and software licenses: The employee’s laptops and networking equipment, both of which require routine upgrades as per market standards is an important recurring cost an IT company has to bear. In addition, many software licenses and SaaS tools and services (ex. email services, testing servers, OS licenses, etc.) have to be paid for on a month to month basis.
  4. Admin overheads: Admin and maintenance staff and office supplies needed for day to day office operations may seem like small expenses in isolation but quickly start to add up.
  5. CA and Accounts: Any software company will need an accounting and CA services to handle their routine compliances, taxes, and payrolls.
  6. Hiring and training costs: Hiring and training people is a stressful, expensive and time-consuming task. Not only is the hiring process difficult, but every organization also has to deal with the problem of employee churn. Every IT company also needs to spend considerable time in training and upgrading employee skills as per current trends and market expectations.
  7. Team activities: A happy and satisfied team is much more than just offering market-rate salaries. Today’s workforce looks for perks, team activities, etc. and as an employer, these are important team building and retention strategies.
  8. Operating profit: Over and above these costs, the software company will keep a profitability margin which will make the business sustainable over the long run.

If you are starting up, it may be a better idea to simply outsource all of the above to a software company so that you have only one thing to focus all your attention on – Your product

5 Ways to Boost Sales on Your Product Pages

15 Great Product Pages that Turn Visitors into Customers

Getting visitors to your website requires a great deal of work and, for many businesses, quite a bit of advertising expenditure. What you don’t want is all this effort and money to go to waste. Once those visitors land on your product pages, you want them to buy your products. Some websites do this far more successfully than others and often the key factor is in the way the products pages are optimised for selling. In this post, we’ll give you 5 tips on how to make your product pages sell more.

  • Make sure you have an effective call to action

Call To Action Examples: Write An Effective CTA In 5 Steps | Ballantine

The ultimate aim of any product page is to sell the product. On a website, this means getting the visitor to carry out an action, usually clicking on a button which may say ‘Add to Basket’ or ‘Buy Now’. That button, or to be precise, the words written on it, is your call to action, i.e., it is directing the customer what to do.

The call to action is one of the most crucial elements on the page and if it is ineffective, it will impact on your conversion rates. To increase the effectiveness of your call to action button,the instructions need to be clear and carrying them out needs to be easy. The more complex it is, the fewer visitors will click. All it needs to do is guide the visitor on the next step of the buying journey.

In addition to being simple, it also has to be conspicuous. If it is hard to find, some customers are going to miss it, get frustrated and go shopping elsewhere. For this reason, it needs to be clearly visible, appropriately sized to catch attention and stand out from the other elements of the page, such as your product description. Using a contrasting colour for the button’s font and background can also help improve its chances of being clicked.

To improve effectiveness even more, you can use A/B split testing to test different versions of your call to action to see which of them has the biggest effect on conversions.

  • Use product images of the highest quality

COPPER PLATED BULLETS | Lead Extrusions

If people are going to buy something online, product photography and video are the only things that let them see what it looks like. It doesn’t take a genius to work out, therefore, that if the photographs are naff, the products featured in them aren’t going to look too good either. If your site has poor quality images, it’s unlikely to be achieving the levels of sales it could be doing.

Unfortunately for those sites, product images are some of the most powerful elements of a product page. When done well, not only do they give a thorough idea of what the product actually looks like, they also put the product in a setting that sells an aspiration that the customer wants to achieve. They won’t just see a vacuum cleaner, they’ll see the clean house with designer furniture that matches the lifestyle they aspire to.

It’s these clever images with their powerful messages that grab the customer’s attention and make them want to buy. To improve your product pages effectiveness, make sure you use high-quality images which show various views of the product and, if possible, show how it will improve the life of the purchaser. Key to this, however, is making sure that the images you use reflect the aspirations of your target audience and show off the identity of your brand.

  • Use product descriptions that sell

Product Description: 9 Examples of Product Descriptions that Sell

Many product descriptions fail to be effective because they focus too much on the features of a product and not enough on the benefits of owning it. What you need to consider is that when people buy something, they are looking for a solution. They want a product that will solve a problem, whether that’s a vacuum cleaner to make it easier to clean the house or a new jacket to make them feel good when they are going out.

An effective product description will illustrate how a feature solves a problem or benefits the consumer. For example, if a vacuum cleaner is bag less, then state the benefits that it is easier to empty and will save money on the cost of replacement bags.

While you may think it is obvious what the benefits are, this doesn’t mean you should assume the same for your customers. What’s more, it is possible to write the benefits to match the needs and aspirations of your target audience.

  • Write copy for people, not search engines

SEO Copywriting: How to Write Content For People and Optimize For Google

With so much focus on SEO and doing well in search engine results, the importance of how well the copy reads for a visitor is often overlooked. However, if all they find is a bulleted list of features and descriptions that are overloaded with keyword phrases, it is not going to keep them engaged.

Write copy that is interesting to read, speaks directly to the visitor and which includes the language that they use to describe the product – and if you need guidance on where to discover what they say, just look up the product or similar products on publicly available review sites.

Finally, remember that the voice and tone that you use in your writing should be one which is both appealing to your readers and which matches the identity of your brand.Â

  • Include FAQs, specifications and live chat

How to Write Effective FAQs: Complete With 10 Best Examples

One of the biggest advantages of buying from a bricks and mortar store is that there is always someone there who can deal with your questions. Those people who shop online will have the same questions but don’t always have the opportunity to find the answers. If you run an eCommerce site, you need to find out what those questions may be and provide the answers in an FAQ section. If not, your customers may buy from websites where the answers are available.

Over time, you’ll have received emails or online chat questions about your products and these should be the starting point for your FAQ section. Displaying a detailed product specification can also help provide answers.Â

The other key feature of many of today’s product pages is live chat. This enables a member of your team to answer any questions about a product there and then as well as deal with any other issues a customer has.

Conclusion

Effective product pages are critical to the success of any online store. In this post, we have looked at five different elements which can help improve overall sales. With better calls to action and product images, copy that focuses on benefits and which is written for people, not search engines, and with the addition of FAQs, specifications and live chat, hopefully, you can boost your sales too.Â

error: Content is protected !!