GraphQL – API interactions made efficient

APIs have become ubiquitous with the advancement of mobility. All clients need to access data on the server and API’s define a contract to access that data.REST has been a popular way to expose data from a server after SOAP since it was lightweight and simple for clients. However, when the concept of REST was developed, client applications were relatively simple. With more rapid movements towards mobility, the client applications have grown in complexity and so has their data requirements from the server. And, REST APIs have shown to be too inflexible to keep up with the rapidly changing requirements of the clients that access them. And more often than not, it is very difficult to implement a fully REST compliant API. Most of the APIs are somewhat REST.GraphQL - API interactions made efficient | Humble Bits

There are 2 major factors that have been challenging the way API’s are designed:

  1. Increased mobile usage calls for efficient data loading. With REST, you often have to make multiple calls to fetch the complete details of a resource.
  2. Variety of different frontend frameworks and platforms. Each platform has need of different representation of the same data. As a REST API developer, we mostly send all the data and leave it up to the client to ignore the data that is not needed. But this puts a load on the user’s data plan.

How I learned GraphQL is the better REST | Codementor

GraphQL, unlike REST, is a more efficient, flexible and powerful new option. The new API standard was developed and open-sourced by Facebook. It is now maintained by developers and open source community from all over the world.

It was developed to cope with the need for more flexibility and efficiency. It solves many of the shortcomings and inefficiencies that developers experience when interacting with REST APIs.

GraphQL enables declarative data fetching where a client can specify exactly what data they need. Instead of multiple endpoints, which return fixed data structure, there is a single endpoint which returns precise data that the client asked for.

To better understand the difference between GraphQL and the REST, let’s consider a blogging mobile application where we want to show a user’s profile screen with the following details on the screen:

User’s name

User’s All blogs title

User’s followers

Remember how we used to gather data with a REST API? It was typically done by accessing multiple endpoints. In the example, /users/<id> endpoint can be used to fetch the initial user data.

Also, it’s likely to have a /users/<id>/posts endpoint that will return all the posts for a user.

Next, the third endpoint will be /users/<id>/followers that will return a list of followers per user.

This leads to the client sending multiple calls, waiting on all those calls, chaining their responses, and gracefully handling if any one of the calls fails.

This highlights the first problem stated above.

Now coming to the second problem-

In this case, at the first step, we are fetching not only user’s name, which we need, but we are also fetching other data which is not required putting more load on the user’s data plan. Similarly, a lot of additional data is being sent across in other calls. This must be to support other clients like a corresponding web application which displays more information as the real estate available increases.

A possible solution within REST realm to solve the above problems would be that you could design your API in a way that exposes the data that is required by this particular profile page. But this is, again, not an optimal approach.

Why, you ask? Especially in today’s times, you want to be able to iterate quickly on your designs and experiment with different features. If you have to tweak your API every time you change your designs on the front end, you are not able to move fast. And keep in mind the versioning you would have to handle in your APIs to keep serving previous versions of your application. And you are in a mess.

Another elegant solution

In GraphQL on the other hand, you’d simply send a single query to the GraphQL server that includes the concrete data requirements. The server then responds with a JSON object where these requirements are fulfilled.

Here only a single request is sent to the server with the query in the request’s body with the exact data requirements and it will return the exact data needed by the application.

This solves our problems of over and under fetching.

I am sure many of you must have had this question in your mind-

An iOS app is so different from an Android app and miles apart from even the web app. How would we return different data for each client?

If I didn’t know about Graph QL, my solution would be either of 2:

  • Let’s send all data required by either of apps and leave it on the application to parse as per their requirement. Over-fetching.
  • Let’s create different endpoints or get platform information from the client in request header and return application specific data. On your path to maintainability issues.

GraphQL solves this problem by giving the power to clients to write their own queries to get data that they need. It’s generous that way- always taking the smallest possible request. Whereas, REST generally defaults to the fullest.

Some of the advantages of GraphQL are-

Typed schema

How many time has it happened that the API does not return data in the correct data type? Numbers and booleans are wrapped as a string. And then you debug it to find out the correct data type. This is because REST API contract only defines the data and not the types for that data.

In contrast, GraphQL uses a strong type system to define the capabilities of an API. All the types that are exposed in an API are written down in a schema using the GraphQL Schema Definition Language (SDL). This schema serves as the contract between the client and the server to define how a client can access the data.

GraphQL is a Query Language first

REST APIs are often created initially simple, then slowly more and more query language-like features are tacked on over time.

The most reasonable way to provide arguments for queries in REST is to shove them in the query string. Maybe a ?status=active to filter by status, then probably sort=created, but a client needs sort direction so sort-dir=desc is added. This is all taken care of in GraphQL because it is foremost a query language so you can easily add in query parameters without affecting the readability or creating a chaos of different types of queries.

{

human(id: “1000”) {

name

height(unit: FOOT)

}

}

GraphQL removes “Include vs Endpoint” indecision

Another customization consideration that comes up a lot is when to offer included relationships, and when to use another endpoint. This can be a difficult design choice, as you want your API to be flexible and performant, but includes used past the most trivial uses can be the opposite of that.

You start off with overly simplistic examples like /users?include=comments,posts but end up on /trips?include=driver,passengers,passengers.avatar,passengers.itineraries and worse.

REST would call for a HATEOAS approach, which would need you to make one call to the /trips endpoint, then hit “links”: { “driver”: “https://example.com/drivers/123” }, and again for passengers, and again for child data of each of those passengers.

This is a big win for GraphQL, as forcing the include approach, the GraphQL will be both efficient and consistent.

And now the disadvantages of GraphQL-

REST makes caching easier at all levels

In an endpoint-based API, clients can use HTTP caching to easily avoid re-fetching resources, and for identifying when two resources are the same. The URL in these APIs is a globally unique identifier that the client can leverage to build a cache. In GraphQL, though, there’s no URL-like primitive that provides this globally unique identifier for a given object. However, you can cache your GraphQL results at the front end using Apollo Client and Relay.

GraphQL query complexity

GraphQL doesn’t take away performance bottlenecks when you have to access multiple fields (authors, articles, comments) in one query. Whether the request was made in a RESTful architecture or GraphQL, the varied resources and fields still have to be retrieved from a data source. As a result, problems arise when a client requests too many nested fields at once. Frontend developers are not always aware of the work a server-side application has to perform to retrieve data, so there must be a mechanism like maximum query depths, query complexity weighting, avoiding recursion, or persistent queries for stopping inefficient requests from the other side.

So to conclude, GraphQL is a powerful technology to make the front end applications easier and more efficient. It has its pros and cons and should be taken into consideration when making important architectural decisions based on the specific use cases.

AI Chatbots in Healthcare: UX Research

Designing conversational UI is a challenging task. I say this from my experience of designing a conversational AI chatbot in healthcare. From the moment I began working on it, I knew it wouldn’t be an easy feat. Questions like what kind of visual elements would I use, how can I reduce the user’s cognitive load in effort-intensive activities, were always on my mind. Prior to this, I had worked on UI design of many web and mobile apps. But none of them was as challenging as this one.How A Chatbot Can Help Your Healthcare Business | by Michelle Parayil | Chatbots Life
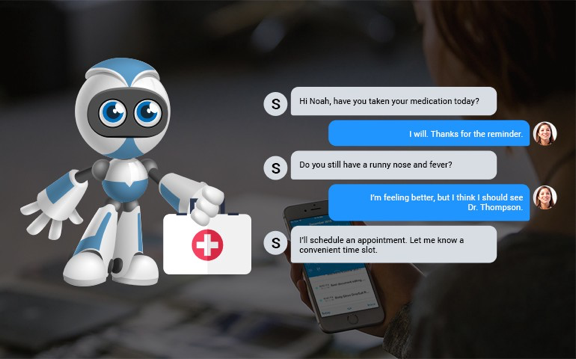
The most challenging part for me was designing to handle the human-machine interaction. Each user is different. Unlike in websites/apps, where users can simply browse and leave, the chatbot users open the chat window to interact. They come with all sorts of questions- vague /smart /genuine /rogue /irrelevant and (sometimes) absurd. When they type a query, they expect the conversational UI to adapt to their needs–digest questions and construct intelligent answers/follow up questions.

The uncertainty of the usage makes the design process complex. Unlike websites/applications, there are no specific UI design principles for designing conversational interfaces. It might appear as a small thing but the limited knowledge on the UI design patterns for healthcare chatbots ultimately affects the customer experience.

So, what can a designer do to make sure that the conversational AI solution caters to most, if not every, user persona? I can share a few suggestions. Since I worked on a healthcare chatbot, most of my suggestions would be about best design practices for healthcare conversational user interface.

Chatbots are now making their way into healthcare solutions like patient engagement solutions, handling emergency situations or first aid, medication management, and so on. To create a great user experience, it’s crucial to pay attention to the process of designing the chatbot. One of the ways to do this is streamlining the process of UI design through UX research.

When I started working on UX research, I borrowed a few tried-and-tested methods applied in web and mobile apps. However, healthcare is a complex domain where data security is a major concern. Therefore, I modified a few of them to suit my needs.

Let’s talk about a few UX research methods which are important to conduct before deep-diving into UI design of a healthcare chatbot.

AI in healthcare | Artificial Intelligence in the healthcare industry

Discover users’ pain points

To discover users’ pain points, you must first know who your users are. So, the first step to any good UX research is defining your user persona. Your user persona should include demographics profiles, health profiles and task profiles.

The persona diagram must include needs, difficulties, frustrations, motivations, aspirations of your end users. For instance, a 56-year old woman’s persona should include pain points like– “I’m an old woman, I don’t have the patience to repeat the same thing over and over again” or “I am ageing towards dyslexia, I forget conversations I had 15 minutes ago.”

After you’ve defined your user persona, the next step is to figure out how they will interact with the chatbot. For that you can invest in any of the below attitudinal approaches-

  • Gather inputs by rolling out surveys to your target audience and asking them related questions.
  • Conduct interviews and listen to what users say.

Depending on the kind of healthcare chatbot, your choice of the method will change.

For example- if you’re doing UX research for a chatbot that guides people towards better mental health, then you can do anonymous email surveys as people don’t openly talk about issues like depression and anxiety.

How Chatbots Can Help Your Healthcare Industry? | BCC Healthcare

Observe users in their natural environment

Direct observation (a primary research method) is the key to understanding user needs and preferences for a new product. During observations, record verbal comments and the time spent on various tasks.

For example, if you’re designing a chatbot for surgeons, then observe them when they plan the pre and post surgical procedure. If the patient has a lot of complications, what dietary guidance do they offer? How do they perform the surgery? What instruments they use and how its usage differs from surgery to surgery?

By conducting interviews with people while they perform tasks, you can collect valuable inputs from them and use it to recreate a similar experience in a conversational chatbot.

You can also create interactive mock-ups to show artificial interactions. This gives sufficient scope to test the chatbot with users without requiring the engineers to actually build it. This helps in quick iterations with the users after validating the user experience and understanding their perception of the chatbot.

Research through complementary data gathering techniques

A quick and rewarding UX research method is secondary research. This is done by doing competitor analysis to see how others are solving the same problem. This approach isn’t useful if you’re developing something unique. But, if it’s something you are trying to improve, this method is easy and gives quick results.

You can experience real conversations, access failure threads and use data to improve your chatbot’s experience. Secondary research also includes searching through customer service logs, FAQs, online reviews or comments on blogs.

For example- if you’re building a patient registration chatbot, look at other chatbots available in the market. What is the tone and personality of chatbot? How much time does it take to book an appointment on the chatbot? What are the demographics that the chatbot covers?

Study the chatbot as a user and find out things that they are doing right or things where the experience could be improved. You will find some unsolved problems that could become a major feature in your chatbot.

Get help from stakeholders

There may be situations where you wouldn’t get time to do surveys and interviews with end users. In such cases, ask for help from people who want to build this chatbot. Get to the behind-the-scenes of the problem. Go to their sales and marketing calls. Understand the ‘why’ behind building a chatbot and what problems they are trying to solve.

Talk to the sales team to understand what kind of customer support calls/tickets they receive frequently. Interview their marketing team to understand what vision they have for their end users. What motivates their users? What do they need in order to be happy? What’s their idea of a good chatbot?

Gather real quotes/statements from the end users and use them to draw an empathy map and user journeys. This will help you identify major pitfalls and crucial moments.

The UX research phase is a crucial part of developing a great customer experience. When it’s given its fair share of time and effort, UX research helps discover important insights and reduces the number of iterations required to build the chatbot.

However, there’s no surety that your research findings will translate into a flawless user experience. All the research findings must be implemented and tested in real-time for you to discover if your research was right or not. Sometimes, a wrong method of research or the timing of the research may give you erroneous information.

I hope you figure out the right UX research method for your chatbot. If you have worked on a healthcare chatbot, I would love to hear the UX research methods you used.

JS Developer: Learn Python

Python and JS are the two most popular programming languages. I was working as a MEAN/MERN Stack Software Engineer where I used Javascript as a coding language. Recently I switched to Python for a second project.
JavaScript vs Python : Can Python Overtop JavaScript by 2020? - GeeksforGeeks

In this blog, I will share my experience of working on both languages at the same time. Let’s get started.

Below are the code snippets which describe the major syntax differences. Can you observe how different they are?

The syntax b/w Javascript and Python are very different as shown in the above sample blocks. Sometimes I make mistakes by using one’s syntax in another. To avoid this these IDE’s are really helpful– IntelliJ (Python) and Vscode (Javascript).

Below are the major differences that I came across:-

  1. Python code uses tabs for a code block whereas JS uses { }
  2. Python uses ‘#’ for comment while JS use ‘//’
  3. Python uses the ‘print’ keyword whereas JS uses ‘console’ keyword to debug anything in the console panel.
  4. Python Function uses a ‘def’ keyword to define function whereas JS uses ‘function’ keyword
  5. The constructor of the Python class is defined by ‘__init__’ whereas JS uses a normal constructor.
  6. The semicolon is not mandatory in both languages to define the end of a statement. But we use it in JS because if we don’t apply it, JS engine will apply it automatically and create unnecessary bugs in the code.


Python VS JavaScript – What are the Key Differences Between The Two Popular Programming Languages?

Approaches to implement task in different languages

Every language has its own beauty. While solving any task with NodeJS I need to think in a different way than implementing them in Python. In some scenarios, Python wins and in some NodeJS.

Just a small example-

To create a Task manager backend in NodeJS, I need to use Express. To replicate the same functionality in Python, I need to use Flask.

Checkout repo for basic task manager https://github.com/agarwalparas/task-manager

However, later on, if my backend needs a functionality of Machine learning to manage tasks and prioritize them on the basis of users’ behaviour, then I will surely use Python.

Whereas if my backend needs high speed to list tasks or to search from tasks or for faster real time updates of tasks within the team, then I will surely use NodeJS.

So, it is really tough to decide which language to use in which project. But it is fairly straightforward to say which language can be used for a particular task.

After some experience, I have figured out a way to decide which language is better for a project.

NodeJS for Chat Applications and Realtime Apps whereas Python for Analytics, Machine Learning, Command Line Utilities.

Some important concepts

F String in Python and Template literals in Javascript

The F string and template literals are great new ways to format strings. Not only are they more readable, more concise, and less prone to error than other ways of formatting, they are also faster!

Decorators in Python and Callback Function in Javascript

Decorators and Callback Function are very powerful and useful tools since they allow programmers to modify the behavior of function or class. In Decorators, functions are taken as the argument into another function and then called inside the wrapper function whereas in Javascript the function passed as argument is called callback function.

Async/Await in NodeJS 

Before async/await, JS used promises but its code was a little complex to debug and caused callback problems.

Then JS introduced a neat syntax to work with promises in a more comfortable fashion. It’s called “async/await” and is relatively easy to understand and use.

Conclusion

So all in all it’s a very exciting journey. Both languages have some pros and cons. But isn’t it the same with everything. Different languages exist because there is no one-size fits all approach to programming. In fact, their existence gives us tools to help create more robust products. My experience of working with Python and JS simultaneously has helped me gain more exposure to the world of programming languages and I now look forward to learning more about other unknown languages.


An Introduction to Big Data Analytics| What It Is & How It Works?


What is Big Data? Let&#39;s answer this question! | by Ilija Mihajlovic | Towards Data Science

Big data is a term that describes datasets that are too large to be processed with the help of conventional tools and also is sometimes used to call a field of study that concerns those datasets. In this post, we will talk about the benefits of big data and how businesses can use it to succeed.

The six Vs of big data
Tourism Intelligence International – Big Data

Big data is often described with the help of six Vs. They allow us to better understand the nature of big data.

Volume

As it follows from the name, big data is used to refer to enormous amounts of information. We are talking about not gigabytes but terabytes ( 1,099,511,627,776 bytes) and petabytes (1,125,899,906,842,624 bytes) of data.

Velocity

Velocity means that big data should be processed fast, in a stream-like manner because it just keeps coming. For example, a single Jet engine generates more than 10 terabytes of data in 30 minutes of flight time. Now imagine how much data you would have to collect to research one small aero company. Data never stops growing, and every new day you have more information to process than yesterday. This is why working with big data is so complicated.

Variety

Big data is usually not homogeneous. For example, the data of an enterprise consists of its emails, documentation, support tickets, images, and photos, transaction records, etc. In order to derive any insights from this data, you need to classify and organize it first.

Value

The meaning that you extract from data using special tools must bring real value by serving a specific goal, be it improving customer experience or increasing sales. For example, data that can be used to analyze consumer behavior is valuable for your company because you can use the research results to make individualized offers.

Veracity

Veracity describes whether the data can be trusted. Hygiene of data in analytics is important because otherwise, you cannot guarantee the accuracy of your results.

Variability

Variability describes how fast and to what extent data under investigation is changing. This parameter is important because even small deviations in data can affect the results. If the variability is high, you will have to constantly check whether your conclusions are still valid.

Types of big data
 Data Characteristics - JavaTpoint

Data analysts work with different types of big data:

  • Structured. If your data is structured, it means that it is already organized and convenient to work with. An example is data in Excel or SQL databases that is tagged in a standardized format and can be easily sorted, updated, and extracted.
  • Unstructured. Unstructured data does not have any pre-defined order. Google search results are an example of what unstructured data can look like: articles, e-books, videos, and images.
  • Semi-structured. Semi-structured data has been pre-processed but it doesn’t look like a ‘normal’ SQL database. It can contain some tags, such as data formats. JSON or XML files are examples of semi-structured data. Some tools for data analytics can work with them.
  • Quasi-structured. It is something in between unstructured and semi-structured data. An example is textual content with erratic data formats such as the information about what web pages a user visited and in what order.
Benefits of big data
5 Benefits of Analytics

Big data analytics allows you to look deeper into things.

Very often, important decisions in politics, production, or management are made based on personal opinions or unconfirmed facts. By analyzing data, you get objective insights into how things really are.

For example, big data analytics is now more and more widely used for rating employees for HR purposes. Imagine you want to make one of the managers a vice-president, but don’t know which to choose. Data analytics algorithms can analyze hundreds of parameters, such as when they start and finish their workday, what apps they use during the day, etc., to help you make this decision.

Big data analytics helps you to optimize your resources, perform better risk management, and be data-driven when setting business goals.

Big data challenges
Challenges| Mercury Fund

Understanding big data is challenging. It seems that its possibilities are limitless, and, indeed, we have many great solutions that rely heavily on big data. A few of those are recommender systems on Netflix, YouTube, or Spotify that all of us know and love (or hate?). Often, we may not like their recommendations, but, in many cases, they are valuable.

Now let’s think about AI-systems that predict criminal behavior. They analyze profiles of criminals and regular people and can tell whether a person is likely at some point to commit a crime. These algorithms are reported to be quite effective.

However, their predictions are not as effective as to give them legal power, mostly because of the bias: algorithms are prone to make sexist or racist assumptions if the data is racist or sexist. You have probably heard about the first beauty contest judged by AI. None of the winners were black, probably, because the algorithm wasn’t trained on photos of black people. A similar fail happened with Google Photos that tagged two African-Americans as ‘gorillas’ ― for the same reason. This demonstrates how important the gender-race sensitivity perspective is when choosing data for analysis. We should improve not only the technology but also our way of thinking before we can create technologies that effectively ‘judge’ people.

How to use big data
How Brands Use Data  - 5 Real World Examples | InfoClutch

If you want to benefit from the usage of big data, follow these steps:

Set a big data strategy

First, you need to set up a strategy. That means you need to identify what you want to achieve, for example, provide a better customer experience, improve sales, or improve your marketing strategy by learning more about the behavioral patterns of your clients. Your goal will define the tools and data you will use for your research.

Let’s say you want to study opinion polarity and brand awareness of your company. For that, you will conduct social analytics and process raw unstructured data from various social media and/or review websites like Facebook, Twitter, and Instagram. This type of analytics allows assessing brand awareness, measuring engagement, and seeing how word-of-mouth works for you.

In order to make the most out of your research, it is a good idea to assess the state of your company before analyzing. For example, you can collect the assumptions about your marketing strategy in social media and stats from different tools so that you can compare them with the results of your data-driven research and make conclusions.

Access and analyze the data

Once you have identified your goals and data sources, it is time to collect and analyze data. Very often, you have to preprocess it first so that machine learning algorithms could understand it.

By applying textual analysis, cluster analysis, predictive analytics, and other methods of data mining, you can extract valuable insights from the data.

Make data-driven decisions

Use what you have learned about your business or another area of study in practice. The data-driven approach is already adopted by many countries all around the world. Insights taken from data allow you to not miss important opportunities and manage your resources with maximum efficiency.

Big data use cases
6 Use Cases in Retail

Let us now see how big data is used to benefit real companies.

Product development

When you develop a new product, you can trust your guts or rely on statistics and numbers. P&G chose the second option and spends more than two billion dollars every year on R&D. They utilize big data as a springboard for new ideas. For example, they aggregate and filter external data, such as comments and news mentions, using Bayesian analysis on P&G’s product and brand data in real-time to develop new products and improve existing ones.

Predictive maintenance

Even a minor mistake or failure in the oil and gas industry can be lethal and cost millions of dollars. Predictive maintenance with the help of big data includes vibration analysis, oil analysis, and equipment observation. One of the providers of such software is Oracle. Their machine learning algorithms can analyze and optimize the use of high-value machinery that manufactures, transports, generates, or refines products.

Fraud and compliance

Digitalization of financial operations can prevent credit card theft, money laundering, and other such crimes. The USA Internal Revenue Service is one of the institutions that rely on processing massive amounts of transactions with the help of big data analytics to uncover fraudulent activities. They use neural network models with more than 600 different variables to be able to detect suspicious activities.

Last but not least

Big data is the technology that will continue to grow and develop. If you want to learn more about big data, machine learning, and artificial intelligence in research and business, follow us on Twitter and Medium and continue reading our blog.

Healthcare solutions with Agile software

Two things that define today’s startup ecosystem are innovation and speed to market. If you’ve a unique idea and if you can get to the market fast, before everyone else, chances are your product will be a success. I don’t imply that these are the only two things that matter. But they play an important role in defining product success.

While some may argue that innovation and speed to market don’t go hand in hand, I heartily disagree. Agile project management is one of the ways that allows innovation without compromising on the delivery timelines.

I have been an agile practitioner for nearly a decade now. I’ve worked in different kinds of projects with different SDLC methodologies. Among them, I find Agile to be one of the best methodologies for project development. Especially in managing those projects where new solutions are required to meet rapidly changing customer needs.

Hospital Information System | Agile Health | Hospital Solutions

Let me share an example. One of our partners, Phritz, began their journey in December 2019. They started building a personal health record chatbot. At that time, they envisioned the chatbot to behave like a personal healthcare assistant that users can chat with anytime. The chatbot would even help users when they change doctors or health insurance.

However, as COVID-19 pandemic started spreading, we began to think of ways in which Phritz could offer extended support. There was a lot of hysteria among people regarding the information available about the virus. We began by thinking of ways to offer a feature in the chatbot where users could add their symptoms and the chatbot would offer answers. For instance, if you have a sore throat, the bot would give advice to take necessary medications. However, if you’ve sore throat, cold, and fever, the bot would suggest you to get a COVID test. If your test comes out to be positive, the bot also offers to inform people whom you’ve met in the past one week.

We couldn’t have imagined adding all these new features if we had chosen waterfall as a project development methodology.

Another example is from one of my recent projects. Our partners wanted to go for HIPAA compliance and secure all the protected health information (PHI) in the project. Securing PHI is an essential in a healthcare setup, so it’s critical to get this step right. This involved creating non-functional stories for securing PHI requirements, ensuring that it covers what has already been built and what will be built in upcoming features.

Since the stakeholders were in full gear with their marketing strategies and were getting the product familiar with the public, it was important for them to get the product to be HIPAA compliant faster.

Evon's Experience of Building HIPAA Compliant Healthcare Solutions

With Agile, it was easier to accommodate this new requirement. In the Waterfall way, our stakeholders couldn’t have thought about implementing this until upon reaching the first milestone.

Implementing agile not only helped us in accommodating the PHI requirements but also helped us with process improvements and clear communication with stakeholders.

These examples show that agile development helps in incremental development of the product– one that conforms to the needs of the users and solves their problems.

Agile can be beneficial to implement in healthcare projects under the below scenarios as well–

When you’re not sure about the entire solution

All great products are built on ideas that first appear on a piece of paper. It’s not necessary to flesh out an idea completely before jumping in to develop it. Strategy and execution are important but getting to the market fast is more important.

Consider Agile in healthcare as a peer to Waterfall

In such cases, agile development helps in validating the idea. You can start with just a goal in mind. Something that’s specific and measurable. For example: “The claim management software will reduce the claims processing time by 70% and improve efficiency of providers by 90%”

Once you develop a solution to this problem, put it out in the market and get customers to use it. After they start using it, collect feedback from them and improve your solution as per their needs.

When you’re navigating a complex domain

The world of healthcare is constantly shifting and innovating. Therefore, if you’re in the race to build the best product, it would no longer help you win. Instead, you ought to focus on  innovating in the services, and improving the customer experience of the product.

One of the best examples is Practo. Before the COVID-19 pandemic, Practo was subliminally known as an online consultation and medicine delivery platform. When the pandemic striked, they quickly pivoted as a telemedicine solution. Within a short span of four weeks, Practo created an ‘Artificial Intelligence’ tool that guided patients after collecting their basic information. The tool leveraged WHO protocols to profile high-risk people by asking them to share their travel and contact history.

This is just one of the many examples. In other healthcare products, you might be dealing with other regulatory guidelines like HIPAA. They make healthcare a complex domain. But with agile development, you can tackle them one at a time.

When there are multiple stakeholders/decision-makers

Healthcare product development might involve many stakeholders and decision makers. Each stakeholder might have a different perspective and goals for the product’s adoption in the market. This might cause a lot of feedback cycles that go in loops and a lot of incremental changes in the product’s features.

Agile teams are equipped to take up new changes, prioritize the needs of all stakeholders, and help you stay on track with rapidly changing requirements.

When you want to improve quality and reduce costs

In healthcare products, there is an unwavering focus on doing things quickly and shipping out features for the world to use and give feedback. Innovation matters the most, along with agility. But funding is limited and you can’t wrap yourself under the garb of innovation. Therefore, features must be rapidly tested. The focus is on failing fast and adapting to the users’ feedback.

In this scenario, agile proves to be the best method. The 2-week/4-week sprint works best in shipping out features that can be tested with the real users.

When product’s scope is variable

In the waterfall approach of product development, the scope of the project is fixed while team members and time can be varied. That is, if you’re halfway through a project when you realize you’re going to miss the timelines, then you either add more team members or extend the timelines. This increases the cost of development and causes delays in reaching the market.

One of the best things about agile development is that here time and people (team members) are fixed whereas the scope can vary as per requirements. It means that once the scope is defined, it’s not the dead-end of discovery.

Is your Healthcare App HIPAA compliant? | Hacker Noon

If after the first sprint’s release you get feedback for adding/removing/improvising features, agile accommodates it. It might impact your final deadlines, but it would still be somewhat near to what you had planned.

Some other advantages of agile teams is that they are more capable of making day-to-day decisions, independently. With a defined and structured process, they can also thrive in different geographical areas.

However, the agile processes are not easy to imbibe. Ceremonies like backlog grooming, sprint planning, need a lot of discipline to execute. I learnt it on the job with the help of my leaders. If you’re a new product manager, I would suggest you to read some good books on agile project management. The Lean Startup by Eric Ries and Sprint: How to Solve Big Problems and Test New Ideas in Just Five Days are two of my favorite books that can help you get married to the idea of agile development.

UX Design of data-intensive applications

We’re living in an age where data is the most precious thing. Data has the power to distort or empower people’s perception and individual decision making capabilities. As a UX designer, it’s on us to design applications that convey the right kind of data in the right way to help make correct decisions.The Visual Display of Quantitative Information by Edward Tufte is a book that talks about the same thing. Jeff Hale shared an interesting story in his book review.“A good chart can inspire action. Early epidemiologist John Snow’s 1854 map with data appears to have saved many lives. Snow showed the location of London’s 13 public wells and 578 cholera deaths by stacked bars perpendicular to their location. His graphic, in part, appears to have helped convince the city to shut down the infected well.”

UX Design of data-intensive applications | Humble Bits

We’re in the 21st century now and I feel we still have a long way to go when it comes to designing data-intensive applications. A data-intensive application is driven by the huge amount of data it consumes. Working with this overwhelmingly huge amount of data has just one problem. It creates various problems for the application because now one has to take care of various aspects such as consistency/standards, usability, scalability and maintainability of the application.

Scalability and maintainability are something that require good application architecture and quality code. But for the scope of this blog, let’s skip that part and talk only about the design.

As designers, we first need to understand that data visualization plays an important role in defining the user experience. The way data is represented on the UI defines how the users are going to interpret and use it. Only when we understand the ‘why’, we’ll be in a position to empower the end users of the application in making informed decisions.

How to design compelling data-intensive applications?

Designing Data-Intensive Applications: The Big Ideas Behind Reliable, Scalable, and Maintainable Systems: Kleppmann, Martin: 9781449373320: Amazon.com: Books

The first step in designing data-intensive applications is determining the mode of representation of data. One can represent data through charts, tables, maps or a combination of these. One of the most common ways to represent data is through dashboards which give a bird’s eye overview of data and share insights that allow users to quickly make decisions or iterate on their current implementation.

For now, let’s talk just about these dashboards and how designers can pay attention to the little details of designing dashboards. Although, different products demand different approach to designing dashboards, but I feel that one can keep a check on the below points to make sure that whatever you design is useful and reliable.

Choose the right visualization method

Future according to Designing Data-Intensive Applications | nexocode

One of my friends recently recommended me an app for managing my finances. She raved about the mobile app so much that I had to download it. I realized it later why she was all praises. The app gave me so much information just at one glance. I could look at my monthly expenditure as well the breakdown of money spent on food, movies, travel etc.

Looking at it from a designer’s perspective, I now know why it clicked for me. For different data sets, they have used an appropriate visualization method.

For example, the monthly report used the line graph so that user can easily identify spikes in expenditure at one glance. Similarly, expense categories are shown in a pie-chart and color coded, so that it’s easier to identify in which category the person spent the most.

So, just before you begin the design of the dashboard, start with an initial understanding of what kind of data you have and what’s the most suitable data visualization method that you can use.

Here are a few data visualizations methods that you can frequently use in dashboards of digital apps-

Line Chart– Line chart is great for showing data trends.

Bar Chart– Bar chart helps in comparing data values of related categories quickly.

Pie Chart– It divides a circle into proportional segments to show percentages between categories.

Gauge Diagram– It’s not a very popular choice, but it can be used in situations where you want to take a different spin on data visualization. For example, in showing the voter’s opinion during the elections, or a client’s opinion on product’s feedback.

UX Design of data-intensive applications | Humble Bits

Plan your layout keeping in mind your end users

A good layout keeps things in place and makes navigation easier for users. Think in terms of the physical space in your house. How do you know which utensils are kept where in the kitchen? How do you wade through the pile of clothes in your closet? It’s because of the layout and the place you’ve fixed for everything.

In the same way, for websites and mobile apps, layout plays an important role. It takes a greater precedence if the application is data-intensive. This is because when you have lots of data, understanding and deriving insights from it is time-consuming.

Therefore, it’s a good practice to keep below practices in mind-

Cut down on extra options

The more choices you give people, the more confused they’ll be. And the more time they’ll take in picking their choice. By the way, that’s not my personal opinion, it’s what the Hick’s law states.

No wonder, why do we take so much time in shopping malls.

But, as a designer, you can be the change you wish to see in the world. All we have to do is resist the temptation to show everything in one single interaction. Not every piece of information can be useful as well as critical. Even if it is, show only that information which is urgent and important for them and which motivates them to take action.

Use progressive disclosure technique to reveal the rest of the information. This way, the users can digest the information quicker and accomplish tasks faster.

An example could be from a news reading website. Showing the entire news could be a little straining for readers. On the other hand, if you just show them the snippets, the readers feel far less cognitively strained.

Do more with less

Some people think that simplicity ruins creativity. But it’s the other way round. Simplicity empowers you to do more with less. It reduces the cognitive load on the users and helps attract attention on the most relevant details.

Be consistent

Consistency is important to help users retain and understand information. We see consistency in almost every aspect of our life.

Consider this as an example- Imagine the chaos in your life if you discovered that the state/country you are visiting has different signals at traffic intersections. In that fictional state, Red no more means stop, Green no more means GO, and yellow is replaced by purple. Now, you have to learn these conventions all over again. Wouldn’t that be messy?

Similarly, in web and mobile applications, it becomes difficult for the user if you keep changing icons, colors, layout, CTAs, etc. An ideal approach that you can take is to make users learn once, use anywhere. 

Select an appropriate color palette


Every color tells a story and that’s why finding the right color palette for data visualization is probably the most crucial step. Choosing appropriate colors also impacts the accessibility of your applications as people who are visually impaired can benefit from your color selection.

There are a few things that you need to remember while choosing your color palette-

Be consistent with colors

If you are using two color variables in a chart, don’t confuse your users with different representation of colors for the same variable.


The Do's And Don'ts of Infographic Color Selection - Venngage

Use desaturated colors for visualization

Desaturated colors like white, black and shades of grey work the best as they do not attract unnecessary attention from the user, rather they convey the information subtly. The more colors you use in your visual representation, the more difficult it becomes for the user to decode the information.

UX Design of data-intensive applications | Humble Bits

Use saturated colors only to draw attention to changes (state) 

If you want to highlight the most important aspects of your chart, use a saturated color instead of throwing all colors together. Make grey your best friend and use it as a base to make sure you neither miss showing the important data points, nor do you overdo with too many colors.

The reason why data-intensive applications deserve more attention while designing is because these applications are complex. Moreover, there are multiple touch-points in such applications which need a touch of innovation so that users interactions become smooth and useful.


Product Development: User research methods

User research is one of the best ways to know what users want and how they interact with your product. It’s performed in order to improve the product as per the feedback gathered at different stages of product development.One of the mistakes that designers and PMs make is that they assume user research needs to be done only in the beginning. However, if you want to build a product that conforms to the needs of the user, research must be a continuous process. At the onset of the product development, user research is required to validate the idea. But when a product is out in the market, user research is needed to understand if users are liking it or not. It’s important to understand users’ needs and their pain points. It’s important to know how they interact and use your products/services, and what kind of challenges they experience while using them.Digital Product Development | Railsware Blog

For this reason, different user research methods are used at different stages of product development. In this blog, I’ll talk about the research methods in detail. But first, let’s see the various stages of product development


Discovery stage (from an idea to an MVP)

Discovery stage starts with an idea. You have a picture in mind about what you want, and the problems you want to solve. But you need to validate your hypothesis.

You need to collect and analyze information about your end users, and their problem areas. You need to get an in-depth understanding of their goals, and challenges that might arise in implementation.

User research in this phase is required to validate those product ideas/hypotheses. When user research is done right, it helps in gathering valuable feedback on the ideas and saves precious time from building unwanted features.

Growth and maturity stage (from MVP to a full-fledged product)  

The growth/maturity stage of the product is when the MVP is already launched in the market and people have already started using the product. The product/service has got enough traction and is on the verge of getting popular.

At this stage, user research is required to understand how users are interacting with the product– are they satisfied with the product, what more would they like to be included, how would they rate the product, where do they feel stuck while using the product, etc.

Good user research helps in iterating over the existing product to build new features, improve existing ones or remove unpopular features. It also helps in getting feedback on the existing features on the product.

Implementing user research in the discovery stage, one can visualize the real pain points of users and build a product that solves users’ problems.

In post-launch user research, one can see how users use a product and what are the gaps that prevent them from accomplishing their goals.

There are different user research methods for each stage. So, first, let’s see the whole spectrum of methods that are available.

A landscape of user research methods

Nielsen Norman Group has conceptualized a variety of user research methods. I’ll be talking about the most common ones used by Product Managers/Design Leaders.

If you want to understand user’s attitude or what users say, then most common methods are-

Surveys :- They consist of a series of questions which give you quantitative information from a large sample set.  It can be used for both validating a hypothesis or gathering feedback from users. Therefore, surveys can be used in both discovery and post launch stages.

User interviews:- They are one-on-one discussions with users to gather qualitative information. Interviews are usually conducted in a small sample set.

They can be used in various ways – exploration to discover the pain points of the users, discovering new ideas for products/features, to test a hypothesis or to know the likes or dislikes of a user.

User interviews can also be used in both discovery and post launch stages.

Contextual inquiries:- In these sessions, users are observed as they perform tasks in their natural environment. This is a method to gather first hand information from the users. In other methods, you only listen as the user tells how he/she performs a certain task. In this, you can observe the user doing these tasks.

This method can also be used in both discovery and post launch stages.

In the discovery phase, one can observe the end users of the product in their environment while they work. This could give insights on what is repetitive in nature and how technology can remove those brainless iterations.

In the post launch stage, we can observe the end user using the MVP and observe where users get stuck or what are the blockers for them. Is there something which is manual and can be easily automated to make users’ life easy?

User feedback:- In user feedback, users give their opinion on the product. This is typically gathered through a link, feedback form, recommend button, etc. One example of gathering user feedback is through Net Promoter Score (NPS) which is a form of user feedback used to know whether a user would want to recommend the product to others.

This is done in the post launch stage of the product in order to improve the existing features.

All of the above methods help build empathy with the users and understand their attitude, likes/dislikes towards product usage.

If you want to understand what people do or how people use your product (also called as usability of the product), then most common research methods are-

A/B Testing :- It’s a quantitative method that allows you to compare two versions of a product and figure out which one works better. It’s used in making incremental changes in a product. There are tools available that allow you to run 2 versions of the same thing. 50% of the users will see one version and another 50% will see another version. Therefore, with A/B testing you could experiment with headlines, button texts or two layouts of the same page.

A/B testing can be used only in the post launch stage of the product.

Eye tracking/Heat maps:- Heat maps allow you to evaluate which sections of the website or app users engage with the most. There are many tools available that allow you to track how users engage with a hyperlink, button, or in what pattern they read the content. This kind of study is very critical to understand what users really care about and what attracts their attention.

It can also be used for the post launch stage of the product.

A case study

To help you understand how research methods vary in different product development stages, let’s take an example of a hypothetical product.

We want to build a virtual mental-health helpline that would help people seek support for disorders like anxiety, depression, etc. This helpline is especially targeted for those who are bearing the brunt of the pandemic and are unable to go out and seek clinical help. Let’s call our hypothetical product –  “Lumos Solem”. (Lumos Solem is the incantation of a Harry Potter spell that produces a blinding flash of sunlight)

In the discovery stage

As a product owner/manager, we would first need answers to some basic questions to validate the idea.

  • Would users be comfortable in using SMS/video to share their problems?
  • How comfortable would the users be in a virtual setup?
  • Who would be my target audience? What age, demographics?
  • What are the most common mental health problems that the helpline would address?
  • Should we get experts on onboard? Who would talk to the people seeking help?
  • Would people get a choice on who they want to talk to? Or will there be an automatic redirection to the first available person?

Digital Product Development | Railsware Blog

At this stage the user research methods that one can use to get answers to above questions can be–

  1. Surveys
  2. Interviews

For conducting the survey–

  1. Define the objective of the survey
    • In our case, it could be “To understand the user behaviour towards a virtual mental health platform”
  2. Identify the target audience and the sample size you need
    • In our case, an example of the target audience could be the most vulnerable  age group – 30- 80 age group and living in metro cities. Sample size can be a mix of middle aged and senior citizens.
  3. Frame the questions in an open and non-leading manner to gather the maximum insights without bias. Questions for Lumos Solem could be –
    • What does mental and emotional health mean to you in your everyday dialogue?
    • Do you feel the urge to talk to someone and just blurt things out to lighten your head? If yes, then what kind of communication could help you in expressing your thoughts?
    • What kind of answers do you seek in your daily routine which affects your mental or emotional wellbeing?Make the answers as multi-choice so that analysis is easier.

After that carry out the survey using any available tool like Google Forms and analyze the data to derive insights. This will help validate the hypothesis we assumed.

For interviews, follow the same steps as above. The only difference here would be to make a rough script, inform the participants the purpose of the discussion.

In growth and maturity stage

Let’s suppose Lumos Solem is in the market and we’ve started getting our innovators & early adopters on the platform.

Now it’s the time to build/remove features and collect analytical data using usability tests. In the post-MVP stage you can ask questions like-

  1. Analytics shows that users are dropping at the onboarding. Why?
  2. Those users who get past user-onboarding, drop off at the payment link. What can we do to retain them?

The user research methods that one can use to get answers to above questions can be–

Feedback form:- Feedback form after every virtual session can help you collect useful information about the quality of interaction. It can be for both mental-health experts as well as the users. This will give users a chance to share what they like or dislike about the service. You are also likely to discover blind spots like technical glitches hampering the quality of conversations, etc.

A/B testing:- If consultation with health experts is paid, you can experiment with the wording of the payment link. The idea is to make users trust in the process. If users are dropping off at the payment link, then you can A/B test the features of Pay now/Pay Later and see if they stay when given an option to pay later.

Heatmaps:- Heatmaps can be used to see what common problems people look for in FAQs. The area where heatmap is densely colored will indicate that users are most interested in reading about a particular topic. This data will help you refine your features so that users can find it easier to accomplish their tasks.

User interviews:- Conducting 1:1 user interviews with experts and users can also help in understanding the problems they are facing in a virtual helpline. At times, people hesitate in sharing their opinion in written format but are more vocal about sharing it in person. In such cases, user interviews come handy.

To conclude,  each user research method has its advantages and disadvantages. The choice of the method will be based on the nature of the product, stage of the product, the users and the answers you’re looking for.

There is a difference between what users say/think and what users do. If you want to know what users say then surveys, interviews and contextual inquiries are suitable to get the information. But if you want to know what users actually do then methods like A/B testing and heat maps are helpful.

I hope I was able to pass on some clarity of which methods to use during a particular product development stage.


error: Content is protected !!