Why The Public Cloud is Best for Big Data?

Public cloud services to push cloud computing revenue during 2018-23 in APAC - TechHerald.in

If you are one of the growing numbers of companies using Big Data, this post will explain the benefits and challenges of migrating to the public cloud and why it could be the ideal environment for your operations.

Cloud-based Big Data on the rise

Cloud computing and the rise of big data - TechRepublic

According to a recent survey by Oracle, 80% of companies are planning to migrate their Big Data and analytics operations to the cloud. One of the main factors behind this was the success that these companies have had when dipping their toe into Big Data analytics. Another survey of US companies discovered that over 90% of enterprises had carried out a big data initiative last year and that in 80% of cases, those projects had highly beneficial outcomes.

Most initial trials with Big Data are carried out in-house. However, many of those who find it successful want to expand their Big Data operations and see the cloud as a better solution. The reason for this is that the IaaS, PaaS and SaaS solutions offered by cloud vendors are much more cost effective than developing in-house capacity.

One of the issues with in-house, Big Data analyses is that it frequently involves the use of Hadoop. Whilst Apache’s open-source software framework has revolutionized storage and Big Data processing, in-house teams find it very challenging to use. As a result, many businesses are turning to cloud vendors who can provide Hadoop expertise as well as other data processing options.

The benefits of moving to the public cloud

One of the main reasons for migrating is that public cloud Big Data services provide clients with essential benefits. These include on-demand pricing, access to data stored anywhere, increased flexibility and agility, rapid provisioning and better management.

On top of this, the unparalleled scalability of the public cloud means it is ideal for handling Big Data workloads. Businesses can instantly have all the storage and computing resources they need and only pay for what they use. Public cloud can also provide increased security that creates a better environment for compliance.

Software as a service (SaaS) has also made public cloud Big Data migration more appealing. By the end of 2017, almost 80% of enterprises had adopted SaaS, a rise of 17% from 2016, and over half of these use multiple data sources. As the bulk of their data is stored in the cloud, it makes good business sense to analyse it there rather than go through the process of moving back to an in-house data centre.

The other benefit of the public cloud is the decreasing cost of data storage. While many companies might currently think the cost of storing Big Data over a long period is expensive compared to in-house storage, developments in technology are already bringing down the costs and this will continue to happen in the future. At the same time, you will see vast improvements in the public cloud’s ability to process that data in greater volumes and at faster speeds.

Finally, the cloud enables companies to leverage other innovative technologies, such as machine learning, artificial intelligence and serverless analytics. The pace of developments these bring means that those companies who are late adopters of using Big Data in the public cloud find themselves at a competitive disadvantage. By the time they migrate, their competitors are already eating into their market.

The challenge of moving Big Data to the public cloud
3 Ways Big Data Can Influence Decision-Making for Organizations

Migrating huge quantities of data to the public cloud do raise a few obstacles. Integration is one such challenge. A number of enterprises find it difficult to integrate data when it is spread across a range of different sources and others have found it challenging to integrate cloud data with that stored in-house.

Workplace attitudes also pose a barrier to migration. In a recent survey, over half of respondents claimed that internal reluctance, incoherent IT strategies and other organizational problems created significant issues in their plans to move Big Data initiatives to the public cloud.

There are technical issues to overcome too. Particularly data management, security and the above-mentioned integration.

Planning your migration

Before starting your migration, it is important to plan ahead. If you intend to fully move Big Data analyses to the public cloud, the first thing to do is to cease investment in in-house capabilities and focus on developing a strategic plan for your migration, beginning with the projects that are most critical to your business development.

Moving to the cloud also offers scope for you to move forward and improve what you already have. For this reason, don’t plan to make your cloud infrastructure a direct replica of what you have in-house. It is the ideal opportunity to create for the future and build something from the ground up that will provide even more benefits than you currently have. Migration is the chance to redesign your solutions so they can benefit from all the things the cloud has to offer: automation, AI, machine learning, etc.

Finally, you need to decide on the type of public cloud service that best fits your current and future needs. Businesses have a range of choices when it comes to cloud-based Big Data services, these include software as a service (SaaS) infrastructure as a service (IaaS) and platform as a service (PaaS); you can even get machine learning as a service (MLaaS). Which level of service you decide to opt for will depend on a range of factors, such as your existing infrastructure, compliance requirements, Big Data software and in-house expertise.

Conclusion

Migrating Big Data analytics to the public cloud offers businesses a raft of benefits: cost savings, scalability, agility, increased processing capabilities, better access to data, improved security and access to technologies such as machine learning and artificial intelligence. Whilst moving does have obstacles that need to be overcome, the advantages of being able to analyze Big Data gives companies a competitive edge right from the outset.

DESIGN THAT DREAM DASHBOARD

Our world is driven by big-data and in this world, dashboards are of utmost significance for providing users with information in just one glance.

Like the dashboard in a car, businesses also employ and utilize dashboards to summarize large chunks of real-time data in a limited space. The information is broken down in a way such that it doesn’t become visually pressurising. This representation of information allows you to measure your data and pick out the areas with scope for improvement. If done right, dashboard designs can bring about a visible difference in the business’ performance. 

Although designing is fun, but, designing a dashboard is not a piece of cake. Rather, it is a quite challenging task. Despite having those inner-creative desires, it is best not to unleash all of your creative streak whilst designing a dashboard. It’s better to keep it in control before it goes out of hands.

KNOW YOUR AUDIENCE

Dashboard is assumed to be allabout data, but that’s not true. It is about information and enabling the users to make smart business decisions. The sole aim of designers is to create a dashboard that makes the users feel powerful. That is how hearts and minds are won.

And in order to do so, you have to know your users. Take a seat, find out what information do they need, what is their field of interest and what is their objective. Once you research and gather all of the required information, you can move forward to begin your work on the dashboard.

Furthermore, you should design dashboards keeping in mind only ONE user. Your dashboard should be providing information according to that single user. In case of multiple users, different dashboards should be designed for the users.

HIERARCHY

While designing a dashboard, it is best to have informational hierarchy, i.e., organising information in a way such that it makes sense to the users. Remember, information placement is not about filling up empty spaces or about aesthetic reasons. Key information should be placed such that it shines different and is easily caught by the users. 

The most significant piece of information related to the user’s primary goal should always appear first. Followed by that should be supportive material which creates context for the forthcoming main content. For the users to make right decisions, it is important that you showcase the relationships between data. This instills a lot more sense into the data than when it was placed randomly. For example, if it is a dashboard for fashion, then you should see the graphs for the hot trends along with the outgoing fashion sales.

LOGICAL DATA GROUPING

This is one obvious point. You should group the required pieces of data in a way that it is clear to the users, that it makes sense. For instance, if you’re designing a dashboard for a cosmetic brand, don’t place the allergy complaints next to the sales data. It just ruins things even further. 

It is best not to follow the usual best designing approach when it comes to dashboard designing. Generally in a website, we place the brand logo on the top-left and navigation options right below that or on the top-right. But as a fact, we humans read from left to right, top to bottom. So it is best advised to place the most crucial piece of information on the top-left corner. Decide wisely.

BE MINIMALIST

Using extra information to please your user will only turn out to be a headache for the user followed by a headache for you. It is always better to keep it minimal, crisp and to the point.

Whilst you’re planning on how to present the information to your user, ask yourself this- what will the user get out of this piece of information? It really works.

Now that you know the placing, try not to clutter too much content on the dashboard. It will only make a mess, which will be for you to clean up. Use minimal text. You would definitely want to avoid unnecessary images and graphics, especially to prevent visual noise. Even if it makes you wonder, simpler, user-friendly design can carry high functionality. And that is, only if the right approach is followed.

DATA VISUALIZATION, THE RIGHT WAY

Data visualization is not merely for the eyes, rather it is a significant part of the dashboard design. Raw data can be hard to process and can have a monotonous tone. The purpose of visualization is to refine the raw data and present the relevant information in a short span of time and at the same, allows users to gain more information, if they wish to do so. Pie-charts, graphs, plots assist users to interpret and better understand the data. However, don’t go overboard with it, you might end up terrorizing your users.

BE WISE, COLOUR-WISE

Colours are great, they make everything better. Likewise, they make data interpretation and analysis much easier for the users. You must choose your alert and button colours wisely, so that your users get notified of tasks, activities, events and features in your interface. Best way is to create a style guide on which you can base your data state.

Dashboards are there for informing righteously, not for experimenting with a colour palette. 

WHEN TO REFRESH YOUR DATA

Data refreshing is important, as it helps in prioritising and placing the elements. For instance, if a data is refreshed often, it implies that the data holds a crucial role. Hence, it is best to place that information in the beginning, at a place where the user can catch it at the earliest possible.

Simultaneously, it is important that you notify your users when the data is/was refreshed. And whether they need to refresh the data manually.

Planning data presentation, especially deciding what to exclude, is truly a SCIENCE. Data alone lacks context and meaning, that is where the designers come in. They take the responsibility of making the data understandable and representable. Dashboards are so crucial for a business, they can make or break your product/application. 

Thus, along with being creative towards the work you love, make the right choices as well.    


An Introduction to Big Data Analytics| What It Is & How It Works?


What is Big Data? Let's answer this question! | by Ilija Mihajlovic | Towards Data Science

Big data is a term that describes datasets that are too large to be processed with the help of conventional tools and also is sometimes used to call a field of study that concerns those datasets. In this post, we will talk about the benefits of big data and how businesses can use it to succeed.

The six Vs of big data
Tourism Intelligence International – Big Data

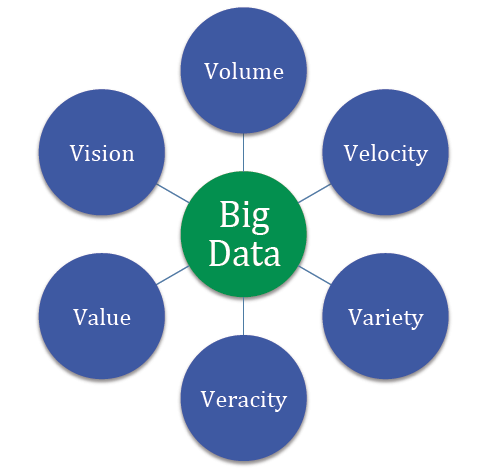
Big data is often described with the help of six Vs. They allow us to better understand the nature of big data.

Volume

As it follows from the name, big data is used to refer to enormous amounts of information. We are talking about not gigabytes but terabytes ( 1,099,511,627,776 bytes) and petabytes (1,125,899,906,842,624 bytes) of data.

Velocity

Velocity means that big data should be processed fast, in a stream-like manner because it just keeps coming. For example, a single Jet engine generates more than 10 terabytes of data in 30 minutes of flight time. Now imagine how much data you would have to collect to research one small aero company. Data never stops growing, and every new day you have more information to process than yesterday. This is why working with big data is so complicated.

Variety

Big data is usually not homogeneous. For example, the data of an enterprise consists of its emails, documentation, support tickets, images, and photos, transaction records, etc. In order to derive any insights from this data, you need to classify and organize it first.

Value

The meaning that you extract from data using special tools must bring real value by serving a specific goal, be it improving customer experience or increasing sales. For example, data that can be used to analyze consumer behavior is valuable for your company because you can use the research results to make individualized offers.

Veracity

Veracity describes whether the data can be trusted. Hygiene of data in analytics is important because otherwise, you cannot guarantee the accuracy of your results.

Variability

Variability describes how fast and to what extent data under investigation is changing. This parameter is important because even small deviations in data can affect the results. If the variability is high, you will have to constantly check whether your conclusions are still valid.

Types of big data
 Data Characteristics - JavaTpoint

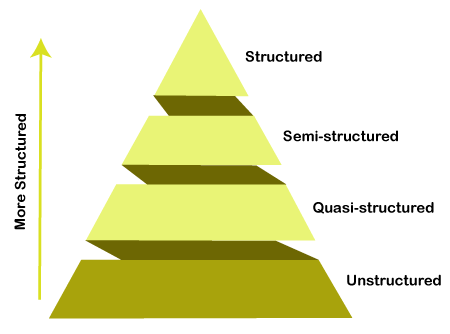
Data analysts work with different types of big data:

  • Structured. If your data is structured, it means that it is already organized and convenient to work with. An example is data in Excel or SQL databases that is tagged in a standardized format and can be easily sorted, updated, and extracted.
  • Unstructured. Unstructured data does not have any pre-defined order. Google search results are an example of what unstructured data can look like: articles, e-books, videos, and images.
  • Semi-structured. Semi-structured data has been pre-processed but it doesn’t look like a ‘normal’ SQL database. It can contain some tags, such as data formats. JSON or XML files are examples of semi-structured data. Some tools for data analytics can work with them.
  • Quasi-structured. It is something in between unstructured and semi-structured data. An example is textual content with erratic data formats such as the information about what web pages a user visited and in what order.
Benefits of big data
5 Benefits of Analytics

Big data analytics allows you to look deeper into things.

Very often, important decisions in politics, production, or management are made based on personal opinions or unconfirmed facts. By analyzing data, you get objective insights into how things really are.

For example, big data analytics is now more and more widely used for rating employees for HR purposes. Imagine you want to make one of the managers a vice-president, but don’t know which to choose. Data analytics algorithms can analyze hundreds of parameters, such as when they start and finish their workday, what apps they use during the day, etc., to help you make this decision.

Big data analytics helps you to optimize your resources, perform better risk management, and be data-driven when setting business goals.

Big data challenges
Challenges| Mercury Fund

Understanding big data is challenging. It seems that its possibilities are limitless, and, indeed, we have many great solutions that rely heavily on big data. A few of those are recommender systems on Netflix, YouTube, or Spotify that all of us know and love (or hate?). Often, we may not like their recommendations, but, in many cases, they are valuable.

Now let’s think about AI-systems that predict criminal behavior. They analyze profiles of criminals and regular people and can tell whether a person is likely at some point to commit a crime. These algorithms are reported to be quite effective.

However, their predictions are not as effective as to give them legal power, mostly because of the bias: algorithms are prone to make sexist or racist assumptions if the data is racist or sexist. You have probably heard about the first beauty contest judged by AI. None of the winners were black, probably, because the algorithm wasn’t trained on photos of black people. A similar fail happened with Google Photos that tagged two African-Americans as ‘gorillas’ ― for the same reason. This demonstrates how important the gender-race sensitivity perspective is when choosing data for analysis. We should improve not only the technology but also our way of thinking before we can create technologies that effectively ‘judge’ people.

How to use big data
How Brands Use Data  - 5 Real World Examples | InfoClutch

If you want to benefit from the usage of big data, follow these steps:

Set a big data strategy

First, you need to set up a strategy. That means you need to identify what you want to achieve, for example, provide a better customer experience, improve sales, or improve your marketing strategy by learning more about the behavioral patterns of your clients. Your goal will define the tools and data you will use for your research.

Let’s say you want to study opinion polarity and brand awareness of your company. For that, you will conduct social analytics and process raw unstructured data from various social media and/or review websites like Facebook, Twitter, and Instagram. This type of analytics allows assessing brand awareness, measuring engagement, and seeing how word-of-mouth works for you.

In order to make the most out of your research, it is a good idea to assess the state of your company before analyzing. For example, you can collect the assumptions about your marketing strategy in social media and stats from different tools so that you can compare them with the results of your data-driven research and make conclusions.

Access and analyze the data

Once you have identified your goals and data sources, it is time to collect and analyze data. Very often, you have to preprocess it first so that machine learning algorithms could understand it.

By applying textual analysis, cluster analysis, predictive analytics, and other methods of data mining, you can extract valuable insights from the data.

Make data-driven decisions

Use what you have learned about your business or another area of study in practice. The data-driven approach is already adopted by many countries all around the world. Insights taken from data allow you to not miss important opportunities and manage your resources with maximum efficiency.

Big data use cases
6 Use Cases in Retail

Let us now see how big data is used to benefit real companies.

Product development

When you develop a new product, you can trust your guts or rely on statistics and numbers. P&G chose the second option and spends more than two billion dollars every year on R&D. They utilize big data as a springboard for new ideas. For example, they aggregate and filter external data, such as comments and news mentions, using Bayesian analysis on P&G’s product and brand data in real-time to develop new products and improve existing ones.

Predictive maintenance

Even a minor mistake or failure in the oil and gas industry can be lethal and cost millions of dollars. Predictive maintenance with the help of big data includes vibration analysis, oil analysis, and equipment observation. One of the providers of such software is Oracle. Their machine learning algorithms can analyze and optimize the use of high-value machinery that manufactures, transports, generates, or refines products.

Fraud and compliance

Digitalization of financial operations can prevent credit card theft, money laundering, and other such crimes. The USA Internal Revenue Service is one of the institutions that rely on processing massive amounts of transactions with the help of big data analytics to uncover fraudulent activities. They use neural network models with more than 600 different variables to be able to detect suspicious activities.

Last but not least

Big data is the technology that will continue to grow and develop. If you want to learn more about big data, machine learning, and artificial intelligence in research and business, follow us on Twitter and Medium and continue reading our blog.

Hadoop based Data Lakes: The Beast is Born

What happened to Hadoop. Hadoop was the next big thing in… | by Derrick Harris | ARCHITECHT

1997 was the year of consumable digital revolution – the year when cost of computation and storage decreased drastically resulting in conversion from paper-based to digital storage. The very next year the problem of Big Data emerged. As the digitalization of documents far surpassed the estimates, Hadoop was the step forward towards low cost storage. It slowly became synonymous and inter-changeable with the term big data. With explosion of ecommerce, social chatter and connected things, data has exploded into new realms. It’s not just the volume anymore.

What is Big Data? Let's answer this question! | by Ilija Mihajlovic | Towards Data Science

In part 1 of this blog, I had set the premise that the market is already moving from a PPTware to dashboard and robust machine learning platforms to make the most of the “new oil”.

Today, we are constantly inundated with terms like Data Lake and Data Reservoirs. What do these really mean? Why should we care about these buzz words? How does it improve our daily lives?

I have spoken with a number of people – over the years – and have come to realize that for most part they are enamoured with the term, not realizing the value or the complexity behind it. Even when they do realize, the variety of software components and the velocity with which they change are simply incomprehensible.

The big question here would be, how do we quantify Big Data? One aspect to pivot is that it is no longer about the volume of data you collect, rather the insight through analysis that is important. Data when used for the purpose beyond its original intent can generate latent value. Making the most of this latent value will require practitioners to envision the 4V’s in tandem – Volume, Variety Velocity, and Veracity.

Translating this into reality will require a system that is:

  • Low cost
  • Capable of handling the volume load
  • Not constrained by the variety (structured, unstructured or semi-structured formats)
  • Capable of handling the velocity (streaming) and
  • Endowed with tools to perform the required data discovery, through light or dark data (veracity)

Hadoop — now a household term — had its beginnings aimed towards web search. Rather than making it proprietary, the developers at Yahoo made a life-altering decision to release this as open-source; deriving their requisite inspiration from another open source project called Nutch, which had a component with the same name.

Over the last decade, Hadoop with Apache Software Foundation as its surrogate mother and with active collaboration between thousands of open-source contributors, has evolved into the beast that it is.

Hadoop is endowed with the following components –

  • HDFS (Highly Distributed File System) — which provides centralized storage spread over number of different physical systems and ensures enough redundancy of data for high availability.
  • MapReduce — The process of distributed computing on available data using Mappers and Reducers. Mappers work on data and reduce it to tuples and can include transformation while reducers take data from different mappers and combines them.
  • YARN / MESOS – The resource managers that control availability of hardware and software processes along with scheduling and job management with two distinct components – Namely ResourceManager and NodeManager.
  • Commons – Common set of libraries and utilities that support other Hadoop components.

While the above forms the foundation, what really drives data processing and analysis are frameworks such as Pig, Hive and Spark for data processing along with other widely used utilities for cluster, meta-data and security management. Now that you know what the beast is made of (at its core) – we will cover the dressings in the next parts of this series. Au Revoir!

Big Data and Cyber security: Together, Stronger

More sophisticated, streamlined and ambitious cyber attacks (with the capability of inflicting destruction to a large extent) have compelled the security experts to look for ways to up their game as well. The propagation of cloud computing which has affected the efficiency of the firewalls (set up for protecting the systems) a bit, has resulted in the security teams of various organizations in opting for strategies that would analyze the behavior of the user and the network.

Enters Big Data

Why the interest in Big Data?

Big data is nothing but extremely large data sets that comprise of structured data like SQL database stores, semi-structured data like the kind present in sensors as well as unstructured data like document files; data that can be mined for information. The approach is already being used in multiple projects throughout the world like during elections (particularly in Obama’s 2012 re-election campaign and Indian General Election 2014). Since the security experts indulged in ensuring cyber security are shifting their focus to the analysis part of the data, services like risk management and managing the actionable intelligence provided by Big Data can be utilized here.

According to CSO, the collaboration between cybersecurity and big data would be best put to use with highly trusted and accurate data along with some functionality to automatically respond to the threats present in the data (being analyzed). Using Big data for ensuring Cyber security will allow organizations to identify hackers attack vectors up to an advanced level and in discovering miscellaneous anomalies.


error: Content is protected !!