
Developing a quality software product falls under the realm of software engineering. The ever changing user requirements and harsh project timelines pave way for cost overruns or delays in the delivery schedule. So, bigger the scope of your project, more complex the functionality becomes. With so many factors it is very easy to lose control over the quality processes to develop an excellent product. We know that no engineering is complete without accurate measurements; which further brings us to the point that all measurements are done by applying certain metrics.For this reason we need software metrics for transparent and quality delivery of the product. Because when you measure what you speak about, you have numbers to express your failure or success. You have a calculated expression which shows you where you lacked and places you stood well. In Bob Parsons’ words-‘Anything that is measured and watched, improves.

Now the question arises- which software metrics to use?
One option is to pick a set of predefined metrics. The other one is you can first define the product requirements, discuss with the various stakeholders and then set the required metrics.
For a better understanding, consider an analogy when you are backpacking for an adventure activity. Would you pack a parachute if you are going for kayaking?
Absolutely not.
Instead, you would first decide upon the adventure sport, do a bit of research and accordingly pack your adventure gear. So, if you are going for paragliding, pack your bag with a helmet and a harness.
You can leave the oars behind for the next time.
Defying the law of gravity? It’s okay. But make sure you don’t cause more harm than good in the project. For this reason, it is important to apply the right metrics at the right stage in the product development cycle. As a software development company which builds engaging products.
1. Team Velocity Points
In simple words, team velocity measures the average speed of your team towards achieving its goal during one sprint. The fact that a typical sprint goes on for about 2-4 weeks, calculation of team velocity points proves to be a valid metric to gather the team’s efficiency.
If you want to calculate your team’s velocity, sum up the story points that were completed during that Sprint. To decide the team’s velocity, a three sprint’s average is usually considered.
Why? It’s an industry standard and it determines the project’s pace at which the functionality is being developed. In simple terms, it tracks the velocity of a Scrum team over time. This metric helps in deciding whether the team can take up more work over time or is the team already overloaded and it need to be reduced.
2. Sprint Burndown
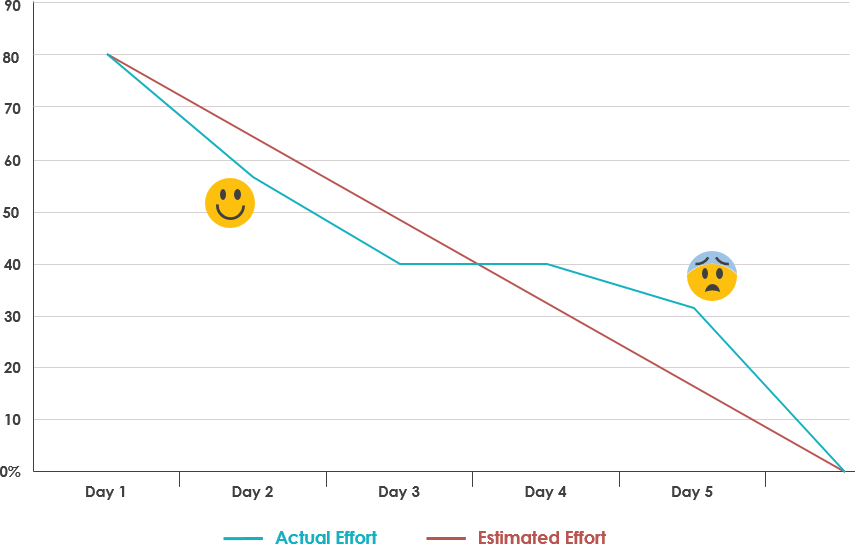
Sprint burndown chart is the most effective tracking metric to visualize the health of the project. It helps in reviewing how much work is pending and if the team needs to speed up or slow down. You can also predict the expected completion date of the sprint. A deviation from the expected burndown will send a red flag to the scrum master to take appropriate actions.
For instance, if burndown goes up at any point during the sprint, it reflects an addition to the existing scope. At this time, it’s important for a team to achieve ‘team’s goal’ first before fetching new items from the backlog.
Why? The Burndown chart indicates the progress of work within a sprint. It shows whether amount of work a team is accomplishing every day will lead to a successful sprint completion or not.
3. Release Burnup
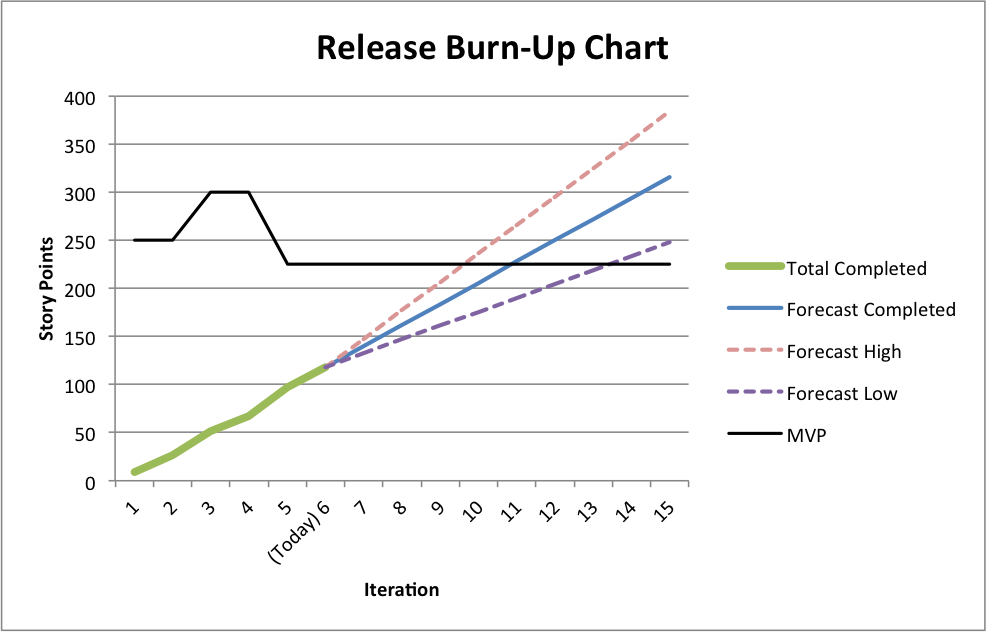
Product owners need to evaluate what should be out in the market first based on their discussions with other stakeholders. Release Burnup helps POs to continuously prioritize product backlog based on how the work is progressing.
If the release date is fixed and there has been a few additions to the initial scope, this is an important metric to align scope with the actual release date by either removing low priority backlog items or attempting to increase velocity by taking suitable measures.
Why? The Release Burnup chart indicates whether the sprints are progressing towards a successful project completion in terms of functionality achieved. Also, gives us a projected date of completion of the project.
4. Estimated Cost vs Actual Cost at Completion
Often there are gaps between the estimated cost projection during the start of the project and the actual cost at completion of the project. This metric gives a measurement of what deviations could have led to this difference in the cost.
Although, almost always the project cost goes higher than the expectation (just like we tend to overspend while shopping), this metric helps you understand what could be the possible cause of cost overrun- be it some design error or some changes in the scope of product development.
Why? Helps us understand what cost we had estimated and what cost was incurred. This helps us in improving our planning.
5. Number of major bugs per sprint
The number is an indicator of the overall quality of the product. When you are working in an agile project, it becomes important to put a budget i.e. count on the number of major defects open in a project at any point of time.
How can we stay within the budget? Reduce the count of defects reported.
How can we reduce the number of defects? Do Not Report!
Yes, I’m kidding.
Here is a better solution- focus at the time of planning, look-ahead and clearly define acceptance criteria before jumping on a sprint backlog item.
The priority of resolving any major bug is over and above implementing any new feature. Because if you can’t resolve what your did wrong, you can not pick a new feature.
At the same time, keep a close watch at the number of bugs reported after production release. If you have not been proactive in refactoring and improving quality of your code, chances are you will receive nasty numbers in this metric. This will help you to identify gaps in testing and take corrective measures

