The digital movement is real. Consumers now possess more content at their fingertips than ever before, and it has impacted how we do business. Companies like Airbnb, Uber, and Waze have disrupted typical business models, forcing established players in different industries to find ways to stay relevant in the ever-emerging digital age. This post is not about that. Well, not in the strictest sense.
There are countless articles explaining the value of being digital. On the other hand, there are very few articles about how to get there. Let’s explore how to get there together, through an approach that I have named Risk-Based Transformation. RBT’s strength is that it puts technology, application, information, and business into one equation.
An approach that fits your specific needs
I’m relocating very soon, and with that comes the joys of a cross-country journey. Being the planning type, I started plotting my journey. I didn’t really know how to start, so I went to various websites to calculate drive times. I even found one that would give you a suggested route based on a number of inputs. These were great tools but they were not able to account for some of my real struggles, like how far is too far to drive with a 5- and 3-year-old.
Where are the best rest stops where we can “burn” energy — ones that have a playground or a place to run? (After being cooped up in a car for hours, getting exercise is important!) How about family- and pet-friendly places to visit along the way to break up the trip? What about the zig-zag visits we need to make to see family?
The list goes on. So while I was able to use these tools to create a route, it wasn’t one that really addressed any of the questions that were on my mind. Organizations of all sizes and across all industries are on this digital journey but often the map to get there is too broad, too generic, and doesn’t provide a clear path based on your unique needs.
A different approach is needed, one in which you can benefit from the experience of others, whilst taking the uniqueness of your business into account. Like planning a trip, it’s good to use outside views in particular to give that wider industry view; however, that’s only a piece of the puzzle. Each business has its own culture, struggles, and goals that bring a unique perspective.
RBT framework
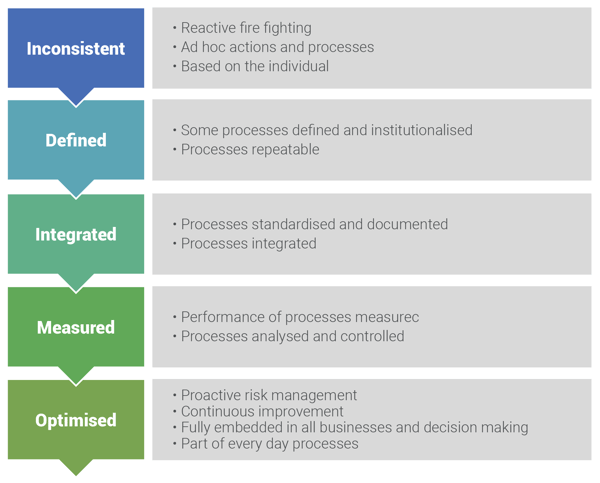
To help with this process, I have created a framework for RBT. At a high level, RBT takes into account your current technology (infrastructure), application footprint, the value of the information, and risk to the business. From left to right, the least weight to the highest. This framework gives a sense as to where to start and where the smart spend is. See flow below:

Following this left to right, you can add or remove evaluation factors based on your needs. Each chevron has a particular view, in a vacuum if you will, so the technology is rated based only on itself. It will gain its context as you move through each chevron. This will give you a final score. The higher the score, the higher the risk to the business.
Depending on your circumstances, you can approach it David Letterman style and take your top 10 list of transformation candidates and run it through the next logic flow (watch for a future blog on how to determine treatment methodology). Or, as we did with a client recently, you can start with your top 50 applications. The point is to get to a place that enables you to start making informed next steps that meet your needs and budget to get the most “bang” for your investment.
The idea behind this framework is to use data in the right context to present an informed view. For example, you can build your questionnaires on SharePoint or Slack, or another collaboration platform that also allows the creation of dashboard views. You can build dashboards in Excel, Access, MySQL, or whatever technology you’re comfortable with in order to build an informed data-driven view, evaluating risk against transformation objectives. The key is that you need to assign values to questions in order to calculate consistent measurements across the board.
A living framework
Many years ago, when you plotted your cross-country drive on your map it was based on information from a fixed time. This was the best route when I drew the line on the map. Now, personal navigation devices hooked into real-time data change that course based on current conditions. In the same way, the RBT model is a living framework; it should have regular iterations in order to have course corrections as you go forward.
The intent of this framework and thinking is to build a context that makes sense for your needs, and then present data in a context that allows for better planning. That better planning should lead to a more efficient digital journey as we all continue to stay with, or ahead of, the curve.
If you have enjoyed this, look forward to my next post. There I will detail how the RBT framework is applied and the treatment buckets methodology.