Cloud Computing Advancing, According to New Statistics

What is cloud computing? Everything you need to know now | InfoWorld

The annual round-up of statistics about cloud computing has now been published by the major research companies and these have provided a wealth of valuable insights into how the cloud landscape is changing. In this post, we’ve chosen some of the more relevant statistics which highlight the areas where cloud computing is developing and where companies are spending their IT budgets. Hopefully, you’ll find these informative.

1. Vast majority of companies using cloud

One Simple Chart: most companies use multiple cloud providers - Gradient Flow

The latest statistics figures from the 451 Research Group show that 90% of companies are now using cloud computing for some of their services. Indeed, the number of workloads running on cloud-hosted servers rose from 48% in 2018 to 60% in 2019.  According to Cisco, this will rise to over 90% within the next two years.

2. UK is a major investor in the cloud

Growing number of UK businesses will be cloud-only soon | ITProPortal

The UK is the world’s third-biggest investor in cloud computing, with companies spending £7.6 billion in 2019. This is just short of the £8 billion invested in China. Both countries, however, are well behind first placed US, which spent almost £100 billion on cloud computing last year.

3. Private vs public cloud

What is the difference between Public, Private and Hybrid Cloud? | by Karan Singh | Medium

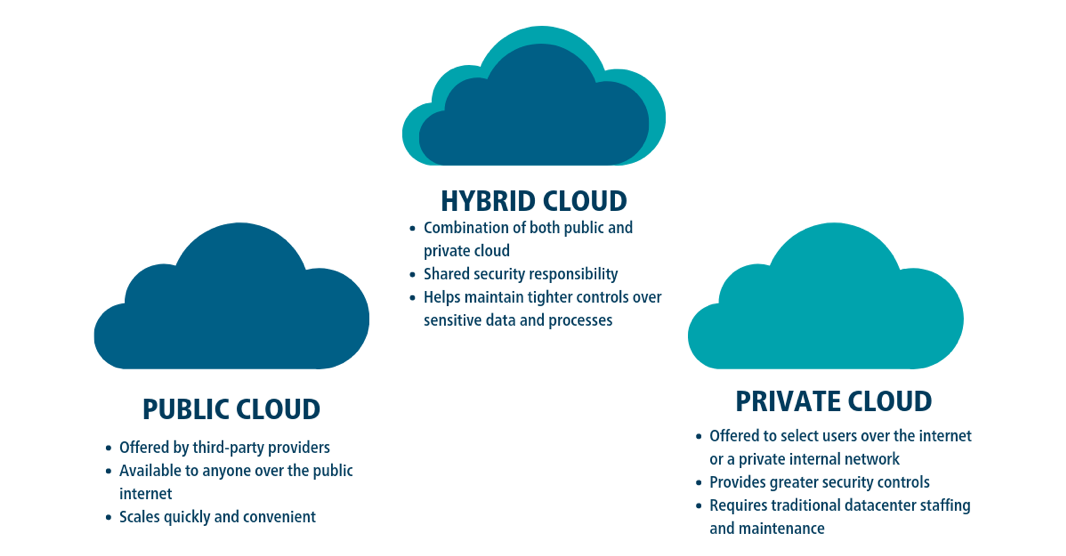
Though more expensive, the average company runs more workloads, 41%, in the private cloud compared to 38% in the public cloud. There is, however, a disparity between how larger businesses and SMEs use these forms of computing. Bigger organisations carry out 46% of workloads in the private cloud and 33% in the public cloud whereas SMEs do almost the opposite: 43% in public cloud and 35% in private. The fact that the spending on public cloud is increasing three times faster than that of private cloud indicates that more small and mid-sized companies are migrating and opting for the public solution when they do.

4. Popular cloud services on the rise

Top Cloud Service Providers & Companies 2021 | Datamation

According to tech media giant, IDG, almost 90% of companies use Software as a Service (SaaS) which enables them to access and make use of software, such as Microsoft 365, over the internet. Cisco predicts that, by 2021, SaaS will handle three-quarters of all cloud workloads.

Infrastructure as a Service (IaaS) has also become very popular with over 80% of companies now using it to provide them with resources, such as servers, virtualisation, data storage and networking, that they need to run apps and carry out workloads.

5. Clear reasons for cloud migration

Two Clouds Data Icon - 6457 - Dryicons

The cloud’s ability to give access to data from anywhere with a connection is the driving force behind over 40% of cloud migrations. The opportunities it provides for collaboration, global networking, BYOD environments and flexible, work-from-home working conditions, together with all the benefits these bring, has made this the primary reason for cloud adoption.

Other major factors to have influenced companies’ decisions include using the cloud for disaster recovery and for reducing the burden on IT staff so that they can concentrate on more business-oriented tasks.

6. Cloud more secure than in-house data centres

Cloud computing em contabilidade: quais os cuidados? | Contabilidade, fiscal e de departamento pessoal - Blog da J.F Granja

According to Gartner, this year will see workloads carried out in public cloud, IaaS environments experience 60% fewer security events than in-house data centres. The main reason for this is that the expense and complexities of maintaining secure in-house systems is difficult for most businesses to achieve. Public cloud providers, on the other hand, have the resources and the income to develop first-class security that uses a multi-faceted approach. As this security comes as part of the cloud service, customers who opt for IaaS can often forgo the issues of developing their own, in-house solution.

While there are still risks when using the cloud, Garner believes that within 2 years over 95% of problems will be caused by customers. Problems resulting from employee errors will be much reduced due to the increasing use of automation.

7. Main uses of cloud  

Five Downsides of Desktop Cloud Computing - Desktop Defenders

Analysis of companies’ cloud spend gives a clear indication about how companies are using it. Currently, large businesses spend a quarter of their IT budgets on cloud services compared to a fifth for SMEs. The biggest spend goes on remote, online backups and disaster recovery solutions, which account for 15% of all cloud expenditure. Web and email hosting, together with online productivity, each account for around 10% of overall spend. 2019 saw companies that had already adopted cloud increase their spending by a quarter. Much of this was to help them better manage the increasing number of workloads they were migrating to the cloud.

Conclusion

As these statistics show, cloud computing is now an integral part of almost every company’s IT strategy. With IaaS helping to drive down IT costs and increase security, SaaS opening the doors to access-anywhere data and flexible working conditions and the ability of the cloud to help with disaster recovery, it is not surprising that 90% of businesses now use it. And these figures don’t even take into consideration the cloud’s ability to provide companies with artificial intelligence, machine learning, big data analysis and all the other powerful technologies available.

COVID-19 : Impact on the Hospitality Industry

The COVID-19 pandemic is fast becoming one of the biggest threats to human lives and the global economy. With governments across the world taking preventive measures of quarantine, social distancing and travel bans, hospitality is one of the first industries to be adversely hit. The impact is not just limited to Italy and China anymore but is increasingly visible across the globe resulting in steep decline in booking trends and occupancy rates.

Impact on US Hotels

The United States has seen an exponential growth in the number of COVID-19 cases in the past couple of weeks. The impact on hotels can be seen in the below chart.

Average hotel occupancy rate | Statista

The trends clearly indicate a continuous decline of room occupancy with a steep change over first two weeks of March. As of 2nd week of March, the industry reported a YoY decline of

  • 24.4% in Occupancy
  • 10.7% in Average Daily Rate (ADR) and
  • 32.5% in Revenue per available room (RevPAR).

Based on the research done by CBRE (Coldwell Banker Richard Ellis), below is the depiction of expected trends for US.

US is 2 weeks behind Italy and 8 weeks behind China in terms of being affected by the pandemic

  • impact on market demand on

If China and Italy are any indication on how the pandemic and its subsequent impact spreads, the major disruption is observed within the first 3 months. For the United States hotel industry, this translates to a steep fall in the occupancy rates reaching 25% to 30% in March and 10% to 15% in April.

A study by hotelAVE estimates that 15% to 20% of the hotels in the United States will close temporarily by the end of March because the fixed carry costs are less than the negative cash flow projected from staying open. While this might be true for certain properties, other hotels and properties are taking some temporary measures to reduce operational costs which include

  • Shutting down of floors
  • Cutting down on amenities and services
  • Cutting down and closing of F&B outlets
  • Encouraging hotel staff to go on unpaid vacation

Irrespective of the measure the properties undertake, there is a high risk of 10% properties to have a permanent shut down as they would not be able to sustain this period.

Past Demand Shocks – An Overview:

2001- During the recession of 2001-02, there was a noted decline in RevPAR by an alarming 10.2%

2008 -The period of 2008-09 saw the RevPAR plummet down by a shocking 16.8%.

2002 – The 2002 SARS outbreak saw occupancy rate decline by a 26% in a comparison between the April-June quarter in 2002 and 2003.

2013-2014 – The Ebola crisis saw a 15% decline in room occupancy rate in sub-Saharan Africa between 2013 and 2014.

The recession periods resulted in a slump in the consumer surplus and leisure travels took the hardest hit. In addition, with increased number of lay-offs, people undertaking business travels were also curtailed.

In contrary, during the SARS or the Ebola outbreaks, there was a consumer surplus, but also an aversion to travel because of perceived hygiene and safety issues.

Hotelchamp Blog: How hoteliers can navigate a demand shock during a crisis

How does COVID-19 outbreak compare to the past demand shocks?

  • Vs SARS/Ebola: The first difference is the sheer scale of COVID-19’s impact. Ebola and SARS epidemics were contained in certain geographical areas, but COVID-19, due to its highly contagious nature, has now permeated across the globe.
  • Vs Recession: Recession periods tend to have a time lag between the actual onset and the start of decline in revenue for the hotel and other industries.
    For COVID-19, the impact was instantaneous. In case there is a steady recovery from COVID-19 outbreak, the impact on hotel industry may not linger on for the whole year. But, it must be noted, that with the scale of economic loss across industries (and given that 2020-21 was already susceptible to a recession in the organic cycle of the business), there is a slight chance that as the COVID-19 outbreak is subdued, it may lead to a prolonged recession – which will in turn result in more losses for the hotel industry.

Time of Recovery in Past Demand Shocks:

In case of prior demand shocks like SARS or Financial crisis, there were at least two quarters before an indication of recovery was shown – in the form of positive monthly growth of occupancy rate.

It also must be brought to attention that metrics like Demand and Occupancy recovered earlier than revenue related attributes like ADR or RevPAR, indicating aggressive marketing and discounting of room prices to get traffic into the hotels.

Following table summarizes the time of recovery that was exhibited by prior demand shocks:

COVID-19 – Impact on Hospitality Industry - Tredence

Road to Recovery

Given that the revenue hit almost zero, most hotel businesses are focusing on reducing costs, and pursuing alternate ways of generating revenue to keep the properties up and running – eg: As some countries lift their lockdown with a mandate of 14-day quarantine period on the incoming travelers, hotel chains are offering quarantine zones for these travelers to ensure footfall. Similar avenues can be approached by other hotel chains to make sure that they do have some revenues trickling in through these tough times.

Once the situation returns to normal, we may see some consolidation amongst the hotel chains, especially amongst the boutique hotels. Businesses would be forced to take a hard look at any new investment they make, and they will be looking at ways to optimize cost.

To nudge customers into their travel patterns, we will see a co-opetition, where all the companies in an industry work together to benefit the industry.

We will witness a lot of re-defining of brands through AI and automation– e.g. Employ innovative usage of Internet of Things (IoT) to enable mobile check-in. This can be leveraged to give a zero-contact experience to the guests thus ameliorating their fears over the disease and its transmission.

Post-recovery, the landscape of the hotel industry will go through a massive overhaul. Given that urban hotels have been hit harder than their rural and sub-urban counterparts, we may see some of the urban properties going into a partial or total lockdown to recuperate some of the loss. Smaller hotel chains may be acquired by the hotel industry giants like Marriott, Hilton etc.

Overall, it is predicted that the world economy, despite taking a severe blow, will be back in positive direction in a years’ time, and will take around 3-4 years to completely nullify the losses accrued during this period.

What do you think? We would like to know your opinion.

error: Content is protected !!