What is Data Drift?
Changes in the data distribution are monitored with Data Drift, one of the most common indicators when monitoring MLOps models. It is a metric that measures the change in distribution between two data sets. Before diving deeper into it, let us examine how ML Works defines drift for a time series use case and how the different drift components provide valuable insights and recommendations.
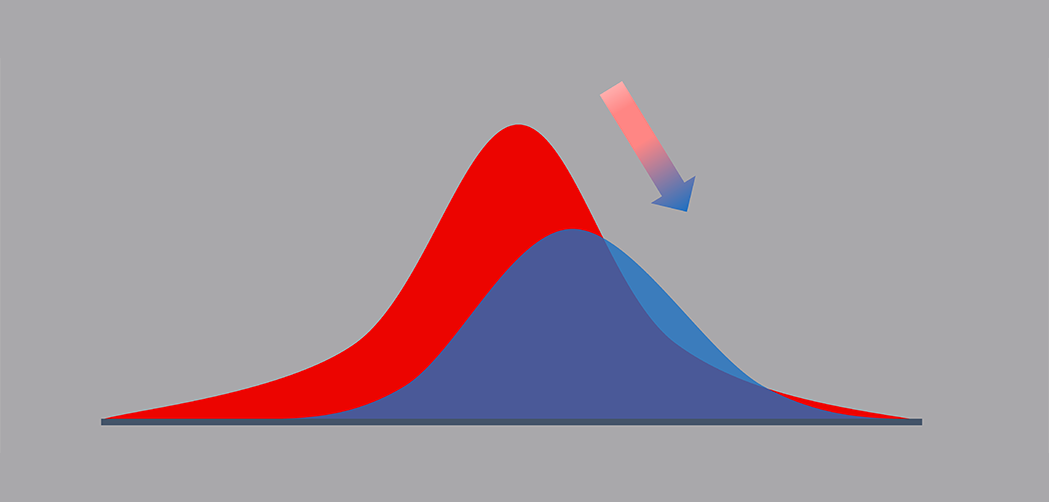
In Illustration 1 below, we can see that distributions of the light blue and dark blue samples (training and test data sets, respectively) are different for the same bin definitions of a feature in the model. This difference in the distribution is what drift quantifies as a percentage of shift.

Illustration 1: Distributions of the training (light blue bars) and the test data (dark blue bars).
Data Drift in Time Series Models
Let’s consider a Promotion Effectiveness Model as an example with four variables:
- Total Promotion Spends
- Promotion Duration
- Product’s Base Price
- Product’s Promoted Price
These variables drive product sales every month, and data drift is measured at the three major aspects of a time series model, i.e.,
- Feature Drift
- Target Drift
- Lag Drift
Feature Drift
In Feature Drift, each variable in the training data is compared with the new stream of data that the model uses to make the prediction. The importance of each feature’s variables and Feature Drift (ex: Promotion Duration) can give an idea of the data problems you need to address as a part of model degradation.
Note: Feature-level insights are applicable to all types of machine learning model.
Target Drift
Target Drift plays an important role in further understanding data issues. It measures how predictions in the new data stream have a different distribution than the trained model’s target variable. Therefore, Target drift indicates how extreme the model predictions can be/are compared to the trained data.
Note: If Target Drift exists despite Feature-level Drift, one can assert that model is under-fitted, and the relationship between the Features(X) and Target(Y) is not robust to making predictions, or that the model is over-fitted to outliers, etc. (The reasons are not exhaustive to the assumptions made above).
Therefore, it is recommended to investigate the model training process and increase the quantity/quality of data entering the model (improve correlation, feature transformations, better stratification, etc.)
Lag Drift
In time series models, auto-correlation is likely to affect the final prediction of the model. Hence, to identify a data pattern change in the lag components, Lag Drift (A direct comparison of the training and test data frame of the model’s lag components) was introduced.
Note: If there is no Feature Drift or Target Drift, but there is Lag Drift, retraining the model with a better data sample is recommended for accurate sales prediction.
Some of the metrics elucidated above can help you set up the capability to monitor the health and degradation of production models and determine the data handling/modeling changes required to implement and sustain ML solutions and automation.

Illustration 2: Functional Flow of the First Step of Automating the ML Solution.
Based on our many years of consulting experience, we have built an enterprise-grade MLOps product called ML Works to address the problems mentioned above and enable ML solutions to take the first step in the MLOps journey.
With the rise of more and more MLOps platforms, the business world is moving towards an inevitable transformation. Today, big players like Google, Microsoft, and Amazon have begun to monetize this space.
As Anteelo’s next-gen industrialized MLOps, ML Works can reduce your Data Scientists’ efforts and lead your organization towards faster and frugal innovations.


