AI in Transportation

AI in Transportation – Current and Future Business-Use Applications | Emerj

Why AI?

You may have heard the terms analytics, advanced analytics, machine learning and AI. Let’s clarify:

  • Analytics is the ability to record and playback information. You can record the travels of each vehicle and report the mileage of the fleet.
  • Analytics becomes advanced analytics when you write algorithms to search for hidden patterns. You can cluster vehicles by similar mileage patterns.
  • Machine learning is when the algorithm gets better with experience. The algorithm learns, from examples, to predict the mileage of each vehicle.
  • AI is when a machine performs a task that human beings find interesting, useful and difficult to do. Your system is artificially intelligent if, for example, machine-learning algorithms predict vehicle mileage and adjust routes to accomplish the same goals but reduce the total mileage of the fleet.

If you’re in travel and transportation, here’s how to make sense of the terms analytics, advanced analytics, machine learning and AI.

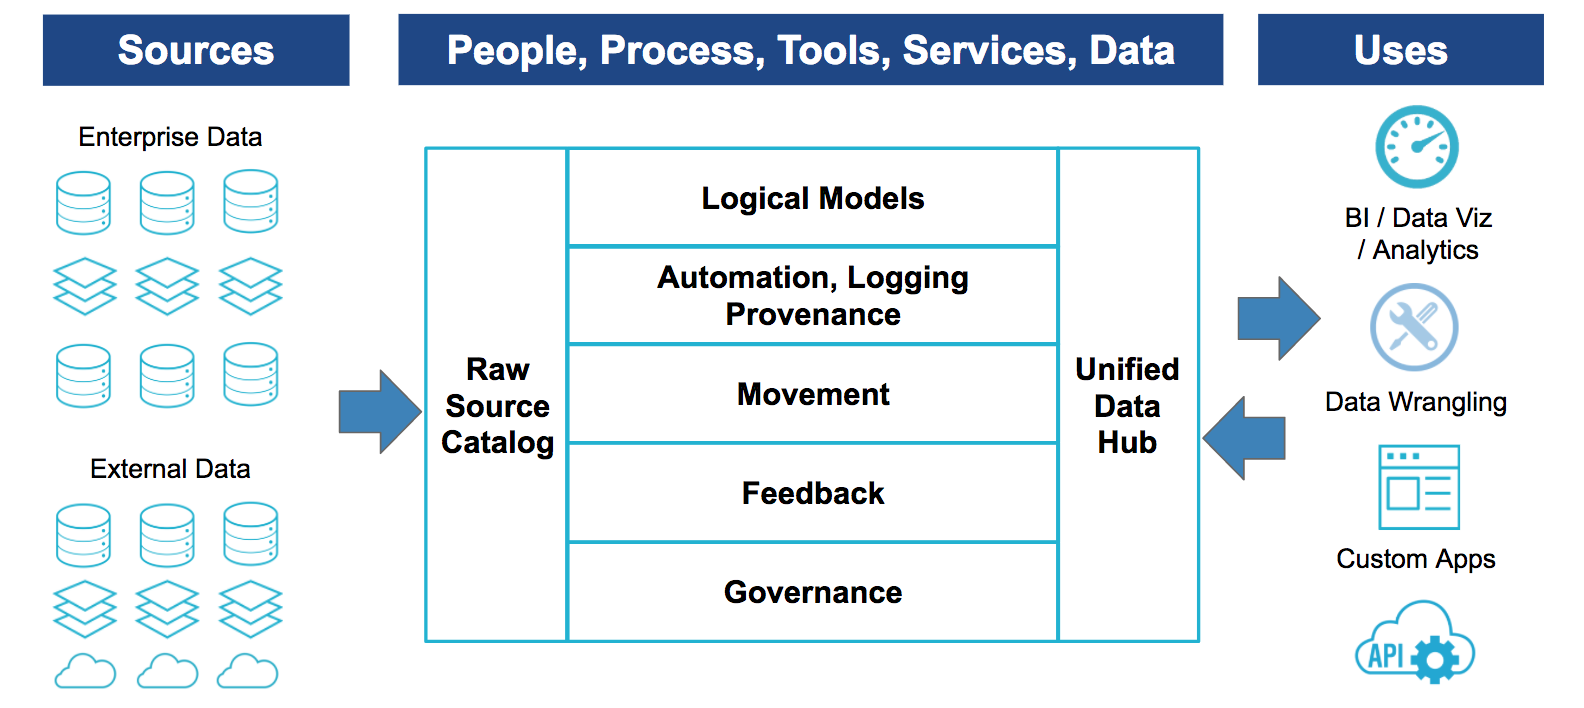
AI is often built from machine-learning algorithms, which owe their effectiveness to training data. The more high-quality data available for training, the smarter the machine will be. The amount of data available for training intelligent machines has exploded. By 2020 every human being on the planet will create about 1.7 megabytes of new information every second. According to IDC, information in enterprise data centers will grow 14-fold between 2012 and 2020.

And we are far from putting all this data to good use. Research by the McKinsey Global Institute suggests that, as of 2016, those with location-based data typically capture only 50 to 60 percent of its value.  Here’s what it looks like when you use AI to put travel and transportation data to better use.

Lack of Action in Congress on Autonomous Technology Could Hinder States, Lawmaker Warns | Transport Topics

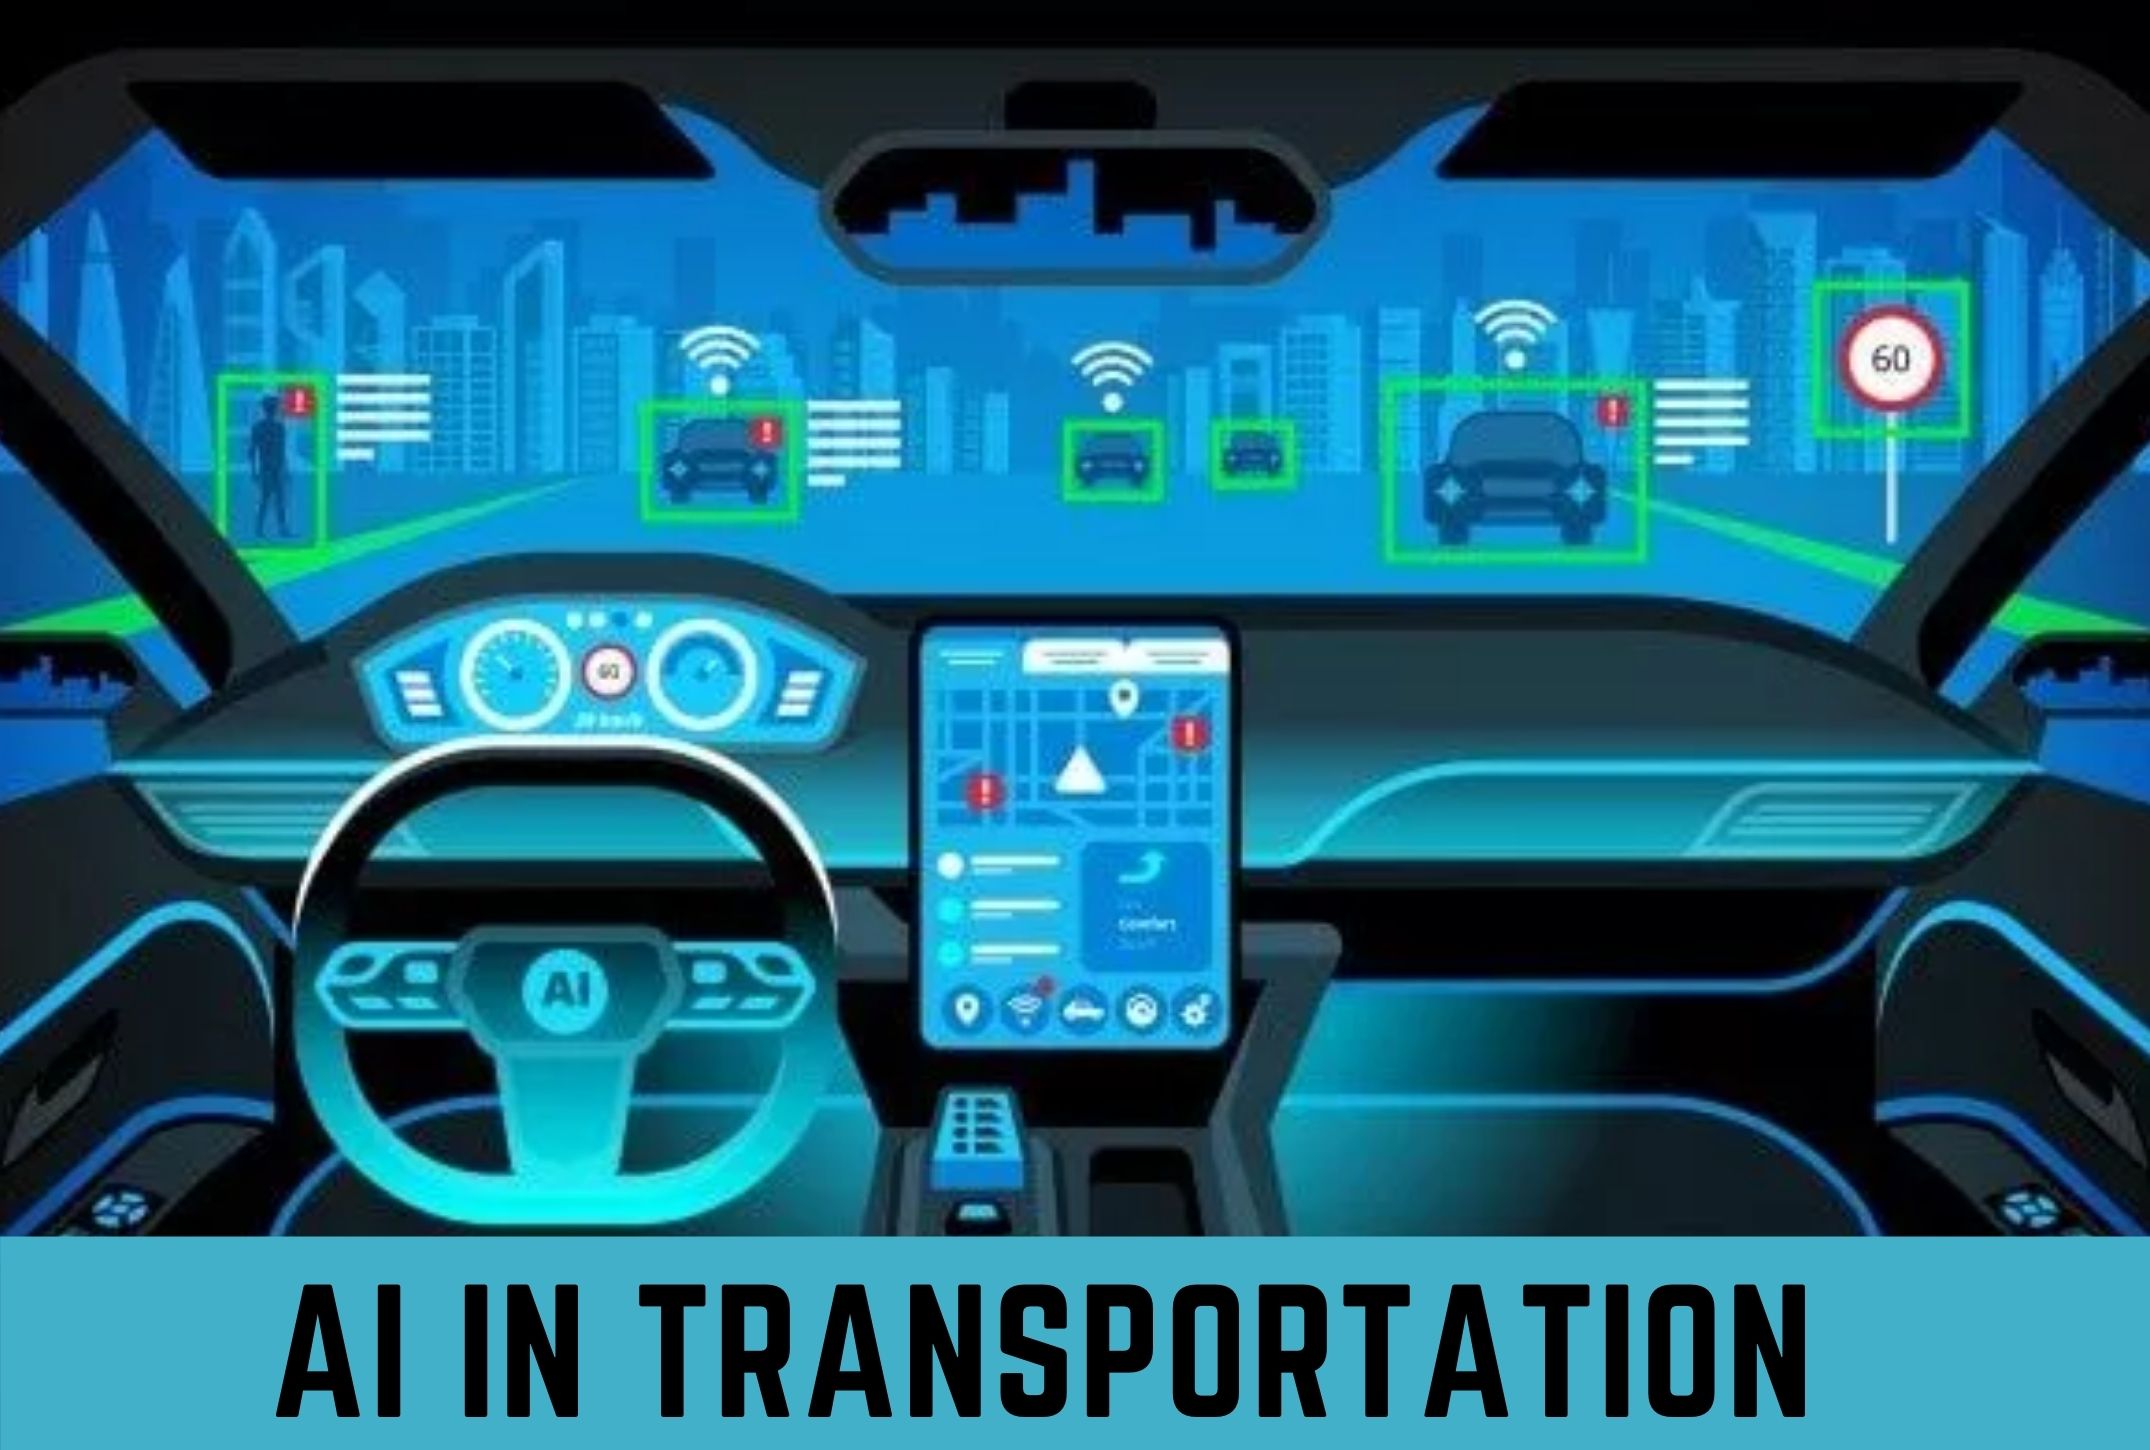
Here’s what it looks like when you apply industrialized AI in travel and transportation.

Take care of the fleet

Get as much use of the fleet as possible. With long-haul trucking, air, sea and rail-based shipping, and localized delivery services, AI can help companies squeeze inefficiencies out of these logistics-heavy industries throughout the entire supply chain. AI can help monitor and predict fleet and infrastructure failures. AI can learn to predict vehicle failures and detect fraudulent use of fleet assets. With predictive maintenance, we anticipate failure and spend time only on assets that need service. With fraud detection, we ensure that vehicles are used only for intended purposes.

AI combined with fleet telematics can decrease fleet maintenance costs by up to 20 percent. The right AI solution could also decrease fuel costs (due to better fraud detection) by 5 to 10 percent. You spend less on maintenance and fraud, and extend the life and productivity of the fleet.

Take care of disruption

There will be bad days. The key is to recover quickly. AI provides the insights you need to predict and manage service disruption. AI can monitor streams of enterprise data and learn to forecast passenger demand, operations performance and route performance. The McKinsey Global Institute found that using AI to predict service disruption has the potential to increase fleet productivity (by reducing congestion) by up to 20 percent. If you can predict problems, you can handle them early and minimize disruption.

Take care of business

Good operations planning makes for effective fleets. AI can augment operations decisions by narrowing choices to only those options that will optimize pricing, load planning, schedule planning, crew planning and route planning. AI combined with fleet telematics has the potential to decrease overtime expenses by 30 percent and decrease total fleet mileage by 10 percent. You cut fleet costs by eliminating wasteful practices from consideration.

Take care of the passenger

The passenger experience includes cargo — cargo may not have a passenger experience directly but the people shipping the cargo do. Disruptions happen, but the best passenger experiences come from companies that respond quickly. AI can learn to automate both logistics and disruption recovery. It can provide real-time supply and demand matching, pricing and routing. According to the McKinsey Global Institute, AI’s improvement of the supply chain can increase operating margins by 5 to 35 percent. AI’s dynamic pricing can potentially increase profit margins by 17 percent. Whether it’s rebooking tickets or making sure products reach customers, AI can help you deliver a richer, more satisfying travel experience.

Applied AI is a differentiator

If we see AI as just technology, it makes sense to adopt it according to standard systems engineering practices: Build an enterprise data infrastructure; ingest, clean, and integrate all available data; implement basic analytics; build advanced analytics and AI solutions. This approach takes a while to get to ROI.

But AI can mean competitive advantage. When AI is seen as a differentiator, the attitude toward AI changes: Run if you can, walk if you must, crawl if you have to. Find an area of the business that you can make as smart as possible as quickly as possible. Identify the data stories (like predictive maintenance or real-time routing) that you think might make a real difference. Test your ideas using utilities and small experiments. Learn and adjust as you go.

It helps immensely to have a strong Analytics IQ — a sense for how to put smart machine technology to good public use. We’vefit built a short assessment designed to show where you are and practical steps for improving. If you’re interested in applying AI in travel and transportation and are looking for a place to start, take the Analytics IQ assessment.

All about Operationalized Analytics

Operationalizing Analytics

Organizations with a high “Analytics IQ” have strategy, culture and continuous-improvement processes that help them identify and develop new digital business models. Powering these capabilities is the organization’s move from ad hoc to operationalized analytics.

Seamless data flow

Operationalized analytics is the interoperation of multiple disciplines to support the seamless flow of data, from initial analytic discovery to embedding predictive and prescriptive analytics into organizational operations, applications and machines. The impact of the embedded analytics is then measured, monitored and further analyzed to circle back to new analytics discoveries in a continuous improvement loop, much like a fully matured industrial process.

An example of operationalized analytics is the industrialized AI utility depicted below. It enables automatic access and collection of data, ingesting and cleaning of the data, agile experimentation through automated execution of algorithms, and generation of insights.

DataOps


Operationalized analytics builds on hybrid data management (HDM), an HDM reference architecture (HDM-RA), and an industrialized analytics and AI platform to enable organizations to implement industrial-strength analytics as a foundation of their digital transformation.

Operationalized analytics encompasses the following:

  • Data discovery includes the data discovery environment, methods, technologies and processes to support rapid self-service data sharing, analytics experimentation, model building, and generation of information insights.
  • Analytics production and management focuses on the processes required to support rigorous treatment and ongoing management of analytics models and analytics intellectual property as competitive assets.
  • Decision management provides a clear understanding of, and access to, the information needed to augment decision making at the right time, in the right place and in the right format.
  • Application integration incorporates analytics models into enterprise applications, including customer relationship management (CRM), enterprise resource planning (ERP), marketing automation, financial systems and more.
  • Information delivery of relevant and timely analytics information to the right users, at the right time and in the right format is enabled by self-service analytics and data preparation. This improves the ease and speed with which organizations can visualize and uncover insights for better decision making.
  • Analytics governance is the set of multidisciplinary structures, policies, procedures, processes and controls for managing information and analytics models at an enterprise level to support an organization’s regulatory, legal, risk, environmental and operational requirements.
  • Analytics culture is key, as crossing the chasm from ad hoc analytics projects to analytics models integrated into front-line operations requires a cultural shift. Merely having a strong team of data scientists and a great technology platform will not make an impact unless the overall organization also understands the benefits of analytics and embraces the change management required to implement analytically driven decisions.
  • DataOps is an emerging practice that brings together specialists in data science, data engineering software development, and operations to align development of data-intensive applications with business objectives and to shorten development cycles. DataOps is a new people, process and tools paradigm that promotes repeatability, productivity, agility and self-service while achieving continuous analytics model and solutions deployments. DataOps further raises Analytics IQ by enabling faster delivery of analytics solutions with predictable business outcomes

Opening spend analytics data to decision makers reducing costs? Here’s Why!

Using Analytics for Better Decision-Making

Spend analytics information has traditionally been closely guarded by procurement. But this approach is arguably a lost opportunity for both procurement and the wider business.

Spending decisions are regularly made by other functions, so for a business to derive the best value and outcome from those decisions, spend analytics information must be used — not just viewed — by all stakeholders.

Before that data can be used effectively, there has to be cohesion and agreement about several key issues. The first issue: There must be a single version of the truth, with everyone working from the same data and analytics. Without a unified approach, different functions will make different decisions based on their own information, and the objective of improving value in spend decisions will be lost.

The second key point: There must be agreement on what is “good enough” for the purposes of the organization. That will vary from company to company. While some might want close to 100 percent accuracy of their spend analytics data, it’s important to understand that achieving close to perfect data will be costly, and it’s unlikely the company will get adequate return on investment. A “good enough” estimate of 80 percent data accuracy will give you enough insight to enable your people to make good spending decisions. It should also be noted that to achieve a single version of the truth and the required level of data accuracy, an organization should work with a specialist that has the data skills to create reliable spend analytics information.

Analytics

Simple access

Other key considerations: ensuring that the data is easy for everyone to access and easy to interpret so the right spend decisions can be made. The level of access and the depth of information must also be adjusted for the individual. For example, the chief executive will have a different requirement compared to a category manager or a buyer in a department. Equally, the information must be targeted to the skill level of the individual. Those with high-level analytical skills should have access to more in-depth spend analytics data, while others might simply want an-easy-to-understand dashboard or application.

The tools users can access are also important. For example, a voice recognition tool that allows users to ask the application a simple question such as, “How much do I spend with suppliers in manufacturing?” might be most useful for some individuals. If the tool is designed properly, it can provide the user with a chart or report with the required information.

If everyone involved in spend decisions has the ability to freely and easily access spend analytics data, companies can start to drive cost savings and achieve greater efficiencies.

Lowering costs and increasing value can be crucial for life sciences organizations where indirect spend is widely distributed across different functions. Without access to information that’s accurate and trustworthy, they can’t make the right buying decisions and won’t adhere to corporate procurement standards or processes.

In fact, most procurement managers are all too accustomed to different departments spending with suppliers that are not part of a purchase order agreement. The procurement managers can save themselves — and their organizations — a lot of pain by making information easily accessible, reliable and user friendly.

Secret to bridging the analytics software gulf :”Iterative methodology + customized solution, leading to self-service BI”

Software Development Services: The Essential Guide | Savvycom

The world of software development and IT services have operated through well-defined requirements, scope and outcomes. 25 years of experience in software development have enabled IT services company to significantly learn and achieve higher maturity. There are enough patterns and standards that one can leverage in-order to avoid scope-creep and make on-time delivery and quality a reality. This world has a fair order.

It is quite contrary to the Analytics world we operate in. Analytics as an industry itself is a relatively new kid on the block. Analytical outcomes are usually insights generated from historical data viz. a viz. descriptive and inquisitive analysis. With the advent of machine learning, the focus is gradually shifting towards predictive and prescriptive analysis. What usually takes months or weeks in software development usually takes just days in the Analytics world. At best, this chaotic world posits the need for continuous experimentations.

The question enterprises need to ask is “how to leverage the best of both worlds to achieve the desired outcomes?”, “how do we bridge this analytics-software chasm?”

Software Development Services: The Essential Guide | Savvycom

The answers require a fundamental shift in perception and approach towards problem solving and solution building. The time to move from what is generally a PPTware (in the world of analytics) to dashboards and furthermore a robust machine learning platform for predictive and prescriptive analyses needs to be as short as possible. The market is already moving towards this said purpose in the following ways:

  1. Data Lakes – These are on-premise and built mostly with the amalgamation of open source technologies and existing COST software’s – homegrown approach that provides single unified platform for rapid experimentation on data along with capability to move quickly towards scaled solutions
  2. Data Cafes / Hubs – Cloud-based SAAS-based approach that allows everything from data consolidation, analysis to visualizations
  3. Custom niche solutions that serve specific purpose

Over a series of blogs, we will explore the above approaches in detail. These blogs will give you an understanding of how integrated and inter-operable systems rapidly allow you to take your experiments towards scaled solutions, in matter of days and in a collaborative manner.

The beauty and the beast are finally coming together!

Beyond owning: From conventional to unconventional analytics data

Shale Oil & Gas Production & Completion Data | unconventional resources production analytics

The scale of big data, data deluge, 4Vs of data, and all that’s in between… We’ve all heard so many words adjectivized to “Data”. And the many reports and literature have taken the vocabulary and interpretation of data to a whole new level. As a result, the marketplace is split into exaggerators, implementers, and disruptors. Which one are you?

Picture this! A telecom giant decides to invest in opening 200 physical stores in 2017. How do they go about solving this problem? How do they decide the most optimal location? Which neighbourhood will garner maximum footfall and conversion?

And then there is a leading CPG player trying to figure out where they should deploy their ice cream trikes. Now mind you, we are talking impulse purchase of perishable goods. How do they decide the number of trikes that must be deployed and where, what are the flavours that will work best in each region?

In the two examples, if the enterprises were to make decisions based on the analytics data available to them (read owned data), they would make the same mistakes day in and day out – of using past analytics data to make present decisions and future investments. The effect of it stares at you in the face; your view of true market potentials remains skewed, your understanding of customer sentiments is obsolete, and your ROI will seldom go beyond your baseline estimates. And then you are vulnerable to competition. Calculated risks become too calculated to game change.

Disruption in current times posits enterprises to undergo a paradigm shift; from owning data to seeking it. This transition requires a conscious set-up:

Power of unconstrained thinking

The Power of the Wandering Mind - WSJ

As adults, we are usually too constrained by what we know. We have our jitters when it comes to stepping out of our comfort zones – preventing us from venturing into the wild. The real learning though – in life, analytics or any other field for that matter – happens in the wild. To capitalize on this avenue, individuals and enterprises need to cultivate an almost child-like, inhibition-free culture of ‘unconstrained thinking’.

Each time we are confronted with unconventional business problems, pause and ask yourself: If I had unconstrained access to all the data in the world, how would my solution design change; What data (imagined or real) would I require to execute the new design?

Power of approximate reality

A Theory of Reality as More Than the Sum of Its Parts | Quanta Magazine

There is a lot we don’t know and will never know with 100% accuracy. However, this has never stopped the doers from disrupting the world. Unconstrained thinking needs to meet approximate reality to bear tangible outcomes.

Question to ask here would be – What are the nearest available approximations of all the data streams I dreamt off in my unconstrained ideation?

You will be amazed at the outcome. For example, the use of Yelp to identify the hyperlocal affluence of catchment population (resident as well as moving population), estimating the footfall in your competitor stores by analysing data captured from several thousand feet in the air.

This is the power of combining unconstrained thinking and approximate reality. The possibilities are limitless.

Filter to differentiate signal from noise – Data Triangulation

Triangulation of Data | Blended & Personalized Learning Practices At Work

Remember, you are no longer as smart as the data you own, rather the data you earn and seek. But at a time when analytics data is in abundance and streaming, the bigger decision to make while seeking data is identifying “data of relevance”. An ability to filter signals from noise will be critical here. In the absence of on-ground validation, Triangulation is the way to go.

The Data ‘purists’ among us would debate this approach of triangulation. But welcome to the world of data you don’t own. Here, some conventions will need to be broken and mindsets need to be shifted. We at Anteelo have found data triangulation to be one of the most reliable ways to validate the veracity of your unfamiliar and un-vouched data sources.

Ability to tame the wild data

Data in the wild | ACM Interactions

Unfortunately, old wine in a new bottle will not taste too good. When you explore data in the wild – beyond the enterprise firewalls – conventional wisdom and experience will not suffice. Your data scientist teams need to be endowed with unique capabilities and technological know-how to harness the power of data from unconventional sources. In the two examples mentioned above – of the telecom giant and CPG player – our data scientist team capitalized on the freely available hyperlocal data to conjure up a great solution for location optimization; from the data residing in Google maps, Yelp, and satellites.

Having worked with multiple clients, across industries, we have come to realize the power of this approach – of owned and seeking data; with no compromise on data integrity, security, and governance. After all, game changer and disruptors are seldom followers; rather they pave their own path and chose to find the needle in the haystack, as well!

How Analytics Can Assist Businesses in Ensuring Safety

The Ultimate List of Free Analytics Tools | Quantcast

the growing threat of cyberattacks, many are turning to analytics to help protect their systems and comply with regulations. Here, we’ll take a close look at what security analytics is and how it can benefit businesses.

Security analytics – an overview

How to improve security analytics and operations | CSO Online

Like all forms of data analytics, security analytics involves the collection and aggregation of a wide range of data from numerous sources. The purpose, however, is to analyse this data to discover vulnerabilities and threats to the security of a company’s systems and data. Data can be gathered from firewalls, routers, network traffic, antivirus software, OS event logs, businesses apps, cloud resources, ID verification and access management logs and endpoint data. It also uses employee and user behaviour data and third-party threat intelligence information. This is then analysed using specially developed security algorithms which seek out patterns and sequences that give insights into potential, emerging or existing threats.

Modern cybersecurity analytics tools also employ AI and machine learning, which enables them to learn from past experiences to continually improve their ongoing threat detection. So, as new threats evolve, they will be able to detect these too. Of crucial importance is that this is done in real-time so that threats can be dealt with proactively and stopped before an attack inflicts damage.

Ways in which security analytics can be used

Stay Ahead of the Security Analytics Market With These Best Practices

Security analytics can be used for a wide range of measures. It can detect links in network traffic activities which signify the emergence of a potential attack. It can discover attackers threatening to infiltrate a system’s endpoints, such as its laptops and mobile phones. It identifies vulnerable, compromised or prohibitively shared user accounts. It blocks unfamiliar communications channels, preventing data being copied, downloaded or transferred without authorisation. It can also safeguard against identity theft by stopping users from sending their details to other sites.

Security analytics can even be used to protect against internal threats; monitoring employee activity to identify intentional or negligent behaviours which put the system’s security at risk. It does this by employing algorithms that uncover suspicious actions which indicate threats or vulnerabilities.

Compliance is another area in which security analytics can play an important role. Here, it can help automate compliance requirements, such as the gathering of log data, the management of data networks and the monitoring of data actions, enabling the company to compile reports and detect users not working in compliance with internal IT policies. Where incidents occur, security analytics can also assist in any forensic investigation, unearthing the activities and sources of the related events.

The benefits of using security analytics

6 Benefits of Security Analytics for Security and Risk Professionals - Download Whitepaper (PDF) » OnlineWhitePapers.com

The chief benefit of using security analytics is that, aside from detecting threats and potential security breaches, it also alerts the company when these incidents are likely to happen and before they actually do. In this way, its insights enable the company to be proactive in its security.

With threats coming from a wide range of sources, such as hacking, malware, ransomware, phishing, internal sabotage and negligence, and with cybercriminals using far more sophisticated tools, some of which also make use of AI and machine learning, many businesses can see real value in security analytics.

Security in the cloud

What is cloud security? | Kaspersky

For businesses using cloud-based systems, it is possible that your vendor already provides a wide range of robust security measures to protect your systems from cybercrime. Here at eukhost, for example, our cloud servers are protected with enterprise-class security. We work in partnership with Fortinet to offer next-gen FortiGate firewalls which feature intrusion prevention and inflow virus protection systems that detect and isolate threats before they reach your server.

In addition, we provide extensive VPN features, DDoS protection, email security, SSL certificates, email signing certificates and more. For added peace of mind, we also provide the industry-leading Veeam backup solution, designed for cloud infrastructures. It features virtual machine backups, replication and encryption which keep your data secure in case of system failure, data corruption, bad updates, ransomware or human error.

When it comes to compliance, the security we provide helps companies meet regulations such as GDPR and PCI DSS. With regard to the latter, all our cloud servers are PCI compliance capable and we can provide the server environment required for this purpose.

Conclusion

As threats become increasingly more advanced, it is good to know that technologies to protect IT systems, such as security analytics, are being developed and deployed to combat them. The best place to host such big data analytics, of course, is in the cloud. It’s reassuring, therefore, that the cloud, itself, already comes with a range of robust security measures to protect you, whether you use security analytics or not.

error: Content is protected !!