Enhancing project management by extending the Scrum framework

How Effective is the Scrum Framework for Project Management

Scrum — a management framework that focuses on cutting through complexity to better meet business needs — maps out the elements required to run a successful project. However, many projects need to go beyond the typical Daily, Planning, Review and Retro meeting sessions used in the Scrum process to be truly successful.

There are ways to enhance your Scrum framework, increase control and improve cooperation with key stakeholders. Below are suggestions for additional meetings, taken straight from Anteelo best practices, that can help keep your process on track.

Scrum Master/Product Owner meeting (SM/PO)

Who Should Attend: Scrum Master and Product Owner

When Should They Meet: Recommended weekly, depending on the size of your backlog

As the name suggests, this meeting takes place between the SM and PO. Since neither is required at the Daily Scrum, they do not have a formal time to share any news, focus on issues or align the responsibilities. But for teams with differing agile experience, the responsibilities of one and another might seem fuzzy. This meeting is dedicated to clearing out that fuzziness.

In an ideal world, every scrum project would be 100% compliant with the Scrum Guide. However, these projects are very hard to come by. That’s why one of the main goals for SM is to create and implement the final vision of the scrum framework for the project, one that’s unique, tailored to your project and containing your own “flavor.” This requires cooperation and alignment between SM and PO.

A useful tool to manage your work is the SM/PO Backlog. This is a separate document with a list of issues or questions you should solve to keep your project running. Examples include trainings for the development team, documentation or stakeholder management.

Risks, Issues, Opportunities Management (RIOM) meeting

Who Should Attend: SM, PO, Program Manager, Development Team, relevant stakeholders

When Should They Meet: Recommended weekly, although it could be less often if merged with another meeting

The primary goal of RIOM is avoiding foreseeable issues. This is seemingly handled during the Daily Standups, when the development team shares any potential threats to the Sprint Goal. On the other hand, fixating only on the short-term risks may result in losing the big picture.

To counter that, we recommend having a separate meeting with relevant stakeholders. Inviting the development team makes sense, as they have hands-on knowledge of risks, issues or opportunities.

Steering Board meeting

Who Should Attend: Steering board, SM, PO

When Should They Meet: Should take place at least once a sprint. A rule of thumb is bi-weekly.

Every project needs control. Scrum makes it easier thanks to transparency and cooperation with the client. Ideally your Product Owner is part of the client’s organization, having a clear communication channel with business stakeholders.

As a Scrum Master, you still want to be able to inform or influence your stakeholders. Experience shows that Review meeting is not enough to avoid hazardous communication gaps. The overall status of the project needs to be tracked and managed closely. The more information shared with stakeholders, the more support you can muster from management.

Transparency is encouraged in the agile approach, and meeting with your Steering Board is crucial to ensure communication gaps are bridged before they cause delays or harm your project. Steering Board meetings can be successfully combined with RIOM.

Roadmap update meeting

Who Should Attend: Scrum Team

When Should They Meet: Quarterly and/or after major business changes of the project

Product Backlog is one of the key tools for Product Owner. Backlog is supplemented beautifully with the Product Roadmap. Product Roadmap outlines high-level directions, functionalities or areas of product development over a 1-year period (could be longer). In other words, it helps express the product vision.

PO is responsible for keeping the roadmap up to date. This document gives the Scrum Team a better understanding of how the sprints align with the overall direction of the project. Although roadmap is created and maintained by PO (in conjunction with the business stakeholders), it’s vital that the Scrum Team stays informed.

This is only a handful of meetings to enhance your Scrum framework, providing  guidelines about possible shortcomings. Ultimately, it’s up to the Scrum Master to tailor the framework to the needs of the project.

Migrating ERP to the Cloud

Migrating ERP to the cloud

Many large companies are considering migrating their ERP applications — including SAP S/4HANA — to the public cloudDrivers for many companies include cost, flexibility or adopting a cloud-first strategy.


Q: What questions do companies ask when they are considering moving ERP applications to a public cloud?

A: First, they ask “Can I move?” These are large, robust systems, and companies want to make sure their apps are technically capable of running in the cloud. The second question they ask is “Should I move?” They want to be confident that when they migrate their mission-critical applications, they can continue running their business. And the third question is, how expensive is a public cloud? We  manages, migrates and runs some of the most complex SAP systems in the world, so I know firsthand that SAP can run effectively in the cloud. SLAs and maintenance can continue in the cloud, and cloud security is well-covered. Cost reduction can be one of the big benefits of public cloud but only if the design, migration and run phases are properly managed.


Q: How do companies decide when the right time is to make the move?

A: Some of our customers have a good business case for waiting to upgrade, but most are exploring their options. Moving to SAP S/4HANA or other ERP systems is a big change, so why not move to cloud at the same time? These are big systems that handle companies’ finance and production lines, so there is often a limited maintenance window to bring them down. If a transition is on your roadmap, you’ll save yourself a step. And in the current macroeconomic climate, a slowdown in system usage is a good time to make changes in preparation for heavier future traffic.


Q: What business disruption can a company expect when it migrates to the cloud?

A: Moving to the cloud is not very different from any other migration. It’s become a routine process, and when done correctly, companies can expect close to near-zero downtime.

Companies can mitigate risks even more if they first test out the migration with one business unit and a single proof of concept. They also should clean up all the data they don’t need before migrating.


Q: What benefits have clients achieved?

A: The benefits are elasticity, agility and being able to grow on command. In the case of SAP, companies can tap into its new analytics capabilities as well as those of the ecosystem they gain when moving to the hyperscalers’ clouds.

If you want to look at business outcomes, consider Croda International, a global chemical manufacturer. It wanted to take advantage of the on-demand capabilities of cloud while increasing the ability of its IT department to respond to business demands. The company developed a strategy for moving to the cloud in anticipation of a major upgrade to SAP S/4HANA. By deploying our Platform as a Service for SAP on Azure as part of a low-risk, phased approach, 106 workloads were migrated in just 12 weeks.


Q: How should companies start the whole process?

A: Companies need to have true conversations — within the business and with their systems integrator. The new environments are richer and easier to consume and combine. At the same time, companies need to think about cost control and avoid lock-in or technical debt. They need to think about what they are trying to achieve, both digitally and in their business. They can introduce new technology. They can think about connecting their SAP landscape to machine learning or the internet of things (IoT). They can introduce new features to customers and suppliers. In the cloud, they can leverage so many things they weren’t able to access before. Thinking about the end state will allow companies to move their businesses forward.

Many large companies are considering migrating their ERP applications — including SAP S/4HANA — to the public cloud. Drivers for many companies include cost, flexibility or adopting a cloud-first strategy.

A 12-point operational resilience structure

Operational Resilience

Businesses today must take a new approach to operational resilience so that they can be more adept at anticipating disruptive events and agile in responding to and recovering from them.

In a world where risks and compliance requirements rapidly expand and evolve, it’s not a question of if there will be a disruption to your services, systems or processes but when.

An organization that improves its approach to operational resilience can greatly minimize its risk when business disruptions occur. That includes external disruptions such as natural disasters, extreme weather conditions and far-reaching medical crises. It also includes internal disruptions such as system outages.

Until quite recently, operational resilience was developed with a risk-avoidance mindset. It was focused on the likelihood of a particular type of disruption occurring, then planning accordingly for that. Given finite resources, disruptions that seemed relatively unlikely to occur were considered low risk and might not be planned for at all.


One size doesn’t fit all

That way of thinking no longer makes sense. Today, organizations face operational disruptions from more sources than ever before, and businesses must widen their planning scope. For instance, companies affected by the supply chain upsets we saw in the past year know now that they have to develop operational resiliency plans to handle those business disruptions. Cybersecurity threats, natural catastrophes, new laws and regulations and even such changes as new competitors entering the market continue to pose their own risks to operational resilience.

There is no one-size-fits-all solution for responding to such a wide range of operational risks. The capabilities needed to respond to a ransomware attack are different from those needed to recover from a massive wildfire.

Responses must also be tailored to align with organizations’ different requirements. A bank that survives a highly publicized cyberattack needs to repair its reputation. An online retailer whose site is shut down after a hurricane needs to restore 24×7 service availability. And a manufacturer with factories in a medical-crisis hot spot needs to provide a safer workplace for employees.

Operational Resilience


The operational resilience framework

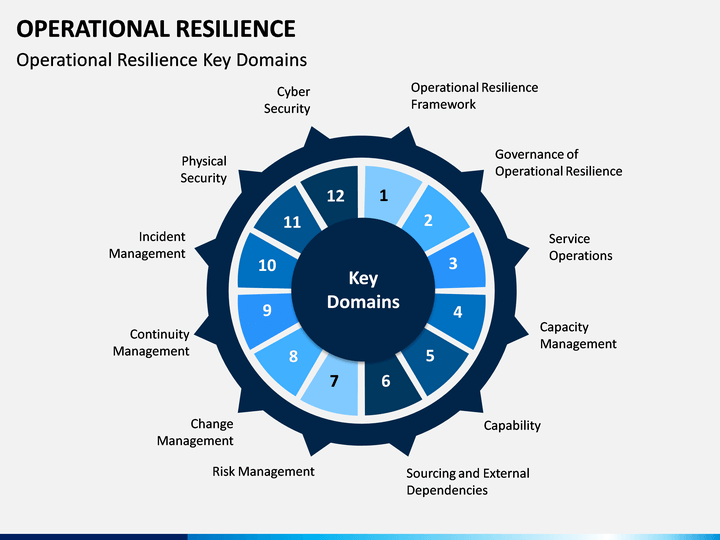
Given all this, what should organizations do to improve their approach to operational resilience? We’ve developed a framework that identifies 12 management disciplines that can be grouped together in different ways to ensure appropriate operational resiliency responses for different risks. The core solutions and services that are available as part of the Operational Resilience Framework combine multiple components of our Enterprise Technology Stack, including applications, security and ITO.

You don’t have to tackle implementing these disciplines all at once. But together, they can enable and strengthen your organization’s operational resilience.

Here’s a quick rundown of the framework’s 12 disciplines and the actions they enable:

  • Continuity management: Analyze business impacts, set return-to-work tactics
  • Corporate incident response: Manage health, safety and environmental risks, proactively mitigate risk
  • Crisis management and communications: Orchestrate response plans, achieve a 360-degree of the current crisis status view
  • Critical enterprise assets: Discover, map and apply governance to key assets
  • Cyber and information security: Respond and recover from attacks
  • Governance, audit and compliance: Continuously monitor compliance, apply industry guidelines
  • IT disaster recovery: Minimize the impacts, structure and test recovery plans
  • Operational risk management: Identify and assess business risks, monitor and minimize issues
  • Organizational behavior: Drive and measure effective attitudes and practices
  • People and culture: Encourage an operating model for resilience
  • Service operations: Assure operational excellence and efficiency
  • Supply-chain management: Manage vendor risk, assure continuity


Real-world resilience

How do you apply this framework? Remember, different risks require different capabilities and responses.

In the case of cyber incidents, for example, your primary focus should be on bringing together capabilities including cyber and information security, IT disaster recovery, critical enterprise assets and governance, audit and compliance.

For business interruptions, you should focus first on building capabilities in areas including continuity management, crisis management and communications, and supply chain management.

Among the main areas of focus for ensuring compliance with new laws and regulations will be continuity management, operational risk management, and governance, audit and compliance.

What’s needed today is an approach to operational resilience that is holistic, free of functional silos and driven by a mindset of “not if, but when.” Organizations that develop this new resilience mindset and practices will be ready for just about anything.

A New Approach For Designing Citizen Services

Citizen service

Most government IT solutions were created only with the intention of automating the back office and focusing on efficiency. Requirements were gathered from case workers and then converted into functionality. The resulting IT solution is entirely focused on the internal operating model.

A similar approach has been taken with most government websites, which are often designed based on a government agency’s internal organisational structure, resulting in a poor user experience for citizens. Far too often, citizens start out on a promising home page, only to get lost in the weeds of dead-end pages, incorrect forms, and even other websites as they try in vain to navigate the unfamiliar organisational structure of the government agency.

But citizens no longer live in an analogue world and they’ve run out of patience. They expect governments to present digital citizen services in an easy-to-use, always-on, self-service, personal, and proactive way.

How to deliver a digital government experience

citizen services

To deliver an experience that meets expectations, it’s clear that we need another approach — one centred around citizens. Requirements and functionality should be derived from the behaviour of the citizen as a customer – what information or service they need, what problem they need to solve, how they want to consume the content — and not from the organisational setup.

This also means that the government needs to provide a seamless and transparent interaction across channels. There is no time to develop a single application per service. Instead we must think in terms of platform models, where new services can be introduced quickly on top of existing services and a standard approach used to build applications.

This kind of transformation doesn’t just involve technology; it requires the transformation of the government organisation itself to improve how it provides services to its citizens via digital channels. It requires a strategy that is endorsed by the organisation’s leadership and mandates a transformation toward a new operating model, new capabilities and processes.

Balancing front- and back office digital programs

Back Office Management Software - How it Works and What it does?

Going digital is not just about revisiting current processes and modernising legacy systems. It is also about balancing programs in the front and back office. This is a critical strategic point. Most digital programs are focused on improving the front office, i.e. the websites or apps that citizens interact with. That’s good insofar as it suggests a focus on citizen interactions. However, that model is unsustainable when the back office continues on as before – manual and labour-intensive, using the same legacy applications, and creating a backlog of requests.

Balance your digital programs with these five enablers

Some governments have already got the message and are redesigning their services with this model in mind. In the United Kingdom, for example, the government has published a set of best practices for designing a good citizen experience. The United States is following along the same lines.

Based on these design principles and drawing on our own experiences working with government organisations, Anteelo has identified five key enablers of successful citizen experience transformation:

Use design thinking. Also called human-centred design, design thinking is a creative problem-solving process that makes the citizen the central focus designing a better experience. It is ideal for tackling front-office related aspects.

How to use design thinking to create a happier life for yourself |

Experiment in an agile way. Traditional approaches such as waterfall development take too long to deliver value. An agile, more iterative approach allows for the kinds of experimentation that can lead to process (and application) innovation in both the front- and back-office. This experimentation is a vital component of any digital journey and must be endorsed to get people, processes and technology aligned to optimise the workload.

Product Discovery: ​A Practical Guide for Agile Teams (2021)

Invest to drive automation. Governments can greatly benefit from introducing new technologies to automate administrative tasks and interconnect and then dynamically manage public infrastructure. Back-office applications can benefit from a surge in efficiency in applying RPA for example.

Global Organizations Turning to RPA to Respond to COVID-19 Pandemic - Express Computer

Get new digital capabilities. Having the right capabilities and people with knowledge and experience is key to executing a digital transformation program. No organisation will be able to introduce new technologies and change the operating model if it doesn’t have the right capabilities among its workforce.

7 Capabilities Central To Digital Transformation

Become data-driven. Government organisations that embrace data can transform services and become more predictive, proactive, preventive and personalised. Becoming a data-driven organisation also brings internal value. For one thing, greater efficiency means better utilisation of resources. Most of all, it brings value to citizens’ experiences by better understanding their behaviour and engaging them in meaningful interactions.

Citizen services

 These enablers, of course, only describe a few key pieces of a more complex puzzle. We explore each enabler in considerably more depth and show how to turn each into concrete actions that drive better citizen outcomes, in our new white paper, Five enablers for governments to serve today’s digital citizens.

A better approach to Data Management, from Lakes to Watersheds


data managementAs a data scientist, I have a vested interest in how data is managed in systems. After all, better data management means I can bring more value to the table. But I’ve come to learn, it’s not how an individual system manages data but how well the enterprise, holistically, manages data that amplifies the value of a data scientist.

Many organizations today create data lakes to support the work of data scientists and analytics. At the most basic level, data lakes are big places to store lots of data. Instead of searching for needed data across enterprise servers, users pour copies into one repository – with one access point, one set of firewall rules (at least to get in), one password (hallelujah) … just ONE for a whole bunch of things.

Data scientists and Big Data folks love this; the more data, the better. And enterprises feel an urgency to get everyone to participate and send all data to the data lake. But, this doesn’t solve the problem of holistic data management. What happens, after all, when people keep copies of data that are not in sync? Which version becomes the “right” data source, or the best one?

If everyone is pouring in everything they have, how do you know what’s good vs. what’s, well, scum?

I’m not pointing out anything new here. Data governance is a known issue with data lakes, but lots of things relegated to “known issues” never get resolved. Known issues are unfun and unsexy to work on, so they get tabled, back-burnered, set aside.

Organizations usually have good intentions to go back and address known issues at some point, but too often, these challenges end up paving the road to Technical Debt Hell. Or, in the case of data lakes, making the lake so dirty that people stop trusting it.

To avoid this scenario, we need to go the source and expand our mental model from talking about systems that collect data, like data lakes, to talking about systems that support the flow of data. I propose a different mental model: data watersheds.

In North America, we use the term “watershed” to refer to drainage basins that encompass all waters that flow into a river and, ultimately, into the ocean or a lake. With this frame of reference, let’s contrast this “data flow” model to a traditional collection model.

In a data collection model, data analytics professionals work to get all enterprise systems contributing their raw data to a data lake. This is good, because it connects what was once systematically disconnected and makes it available at a critical mass, enabling comparative and predictive analytics. However, this data remains contextually disconnected.

Here is an extremely simplified view of four potential systematically and contextually disconnected enterprise systems: Customer Relationship Management (CRM), Finance/Accounting, Human Resources Information System (HRIS), and Supply Chain Management (SCM).

CRM Finance/Accounting HRIS SCM
Stores full client name and system generated client IDs Stores abbreviated customer names (tool has a too-short character limit though) and customer account numbers Stores all employee names, employee IDs
Stores products purchased; field manually updated by account manager Stores a list of all company Locations; uses 3-digit country codes Stores a list of all company locations with employee assignments; uses 2-digit country codes Maintains product list and system- generated product ID
Stores account manager names Stores abbreviated vendor names (same too-short character limit), vendor account numbers and vendor IDs with three leading zeros. Stores vendor names, vendor account numbers, vendor IDs (no leading zeros)
Stores Business Unit (BU) names and BU IDs Stores material IDs and names
Goal: Enable each account manager to track the product/contract history of each client Goal: Track all income, expenses and assets of the company Goal: Manage key details on employees Goal: Track all vendors, materials from vendors, Work in Progress (WIP), and final products


Let’s assume that each system has captured data to support its own reporting and then sends daily copies to a data lake. That means four major enterprise systems have figured out multiple privacy and security requirements to contribute to the data lake. I would consider this a successful data collection model.

Note, however, that the four systems have overlap in field names, and the content in each area is just a little off — not so far as to make the data unusable, but enough to make it difficult. (I also intentionally left out a good connection between CRM Clients and Finance/Accounting Customers in my example, because stuff like that happens when systems are managed individually. And while various Extract, Transform and Load (ETL) tools or Semantic layers could help, this is beyond CRM Client = Finance/Accounting Customer.)

If you think about customer lists, it’s not unreasonable for there to be hundreds, if not thousands, of customer records that, in this example, need to be reconciled with client names. This will have a significant impact on analytics.

Take an ad hoc operational example: Suppose a vendor can only provide half of the materials they normally provide for a key product. The company wants to prioritize delivery to customers who pay early, and they want to have account managers call all others and warn them of a delay. That should be easy to do, but because we are missing context between CRM and Finance/Accounting, and the CRM system is manually updated with products purchased, some poor employee will be staying late to do a lot of reconciling and create that context after the fact.

I’ve heard plenty of data professionals comment something like, “I spend 90% of my time cleaning data and 10% analyzing it on a project.” And the responses I hear are not, “Whaaaa?? You’re doing something wrong.” They are, “Oh man, I sooooo know what you mean.”

Whaaaa?? We’re doing something wrong.

The time analytics professionals spend cleaning and stitching data together is time not spent discovering correlations, connections and/or causation indicators that turn data into information and knowledge. This is ridiculous because today’s technologies can do so much of this work for us.

The point of a data watershed approach is to eliminate the missing context. The data watershed is not a technical model for how to get data into a lake; it’s a governance/technical model that ensures data has context when it enters a source system, and that context flows into the data lake.

If we return to my four example systems and take a watershed approach, the interaction looks more like this, with the arrows indicating how the data feeds each system:

Without data management, forget AI and machine learning in health care - Government Data Connection

While many organizations do have data flowing from system to system, they often don’t have connections between every system. Additionally, it’s not always clear who should “own” the master list for a field.

In my view, the system that maintains the most metadata around a field is the system that “owns” the master data for that field. So, in my example above, both the HR and Finance/Accounting systems maintain Location lists, but they use different country codes. Finance/Accounting is either going to maintain depreciation schedules or lease agreements on the locations, as well, thus Finance/Accounting wins. The HRIS system, unless there is a tool limitation, should mirror and, preferably, be fed the location data from the Finance/Accounting system.

In this example, when each system sends its data to a data lake, it has natural context. Data analytics professionals can grab any field and know the data is going to match – though I would argue that best practice would be to use the field from the “master” system. However, if everything is working right, this should be irrelevant.

Since a data watershed is a governance/technical model, it addresses, not just how data flows, but how it’s governed. This stewardship requires cross-departmental collaboration and accountability. The processes are neither new nor necessarily difficult – but the execution can be complex. The result is worth the effort though, as all enterprise data supports advanced analytics.

The governance model I picture is an amalgamation of DevOps – the merging of software development and IT operations – and the United Federation of Planets (UFP) from “Star Trek.”

By putting data management and data analytics together in the same way the industry has combined software developers and IT operations, there is less opportunity for conflicting priorities. And, any differences must be reconciled if the project hopes to succeed.

After borrowing from the DevOps paradigm, the reason the governance model I like best is the UFP – and not just because I get to drop a Trekkie reference – is because it is the government of a large fictional universe, built on the best practices and known failures of our own individual government structures.

The UFP has a central leadership body, an advising cabinet and semiautonomous member states. I think this set up is flexible enough to work with multiple organizational designs and enables holistic data management while addressing the nuances of individual systems.

I would expect the “President of the Federation” to be a Chief Information, Technology, Data, Analytics, etc. Officer. The “Cabinet” would be made up of Master Data Management (MDM), Records and Retention, Legal, HR, IT Operations, etc. And the “Council” members would be the analytics professionals from all the data-generating and -consuming business units in the organization.

And, it’s this last part – a sort of Vulcan Bill of Rights – I feel the strongest about:

Whoever is responsible for providing the analytics should be included in the governance of the data. Those who have felt the pain of munging data, know what needs to change – and they need to be empowered to change it.

Data watersheds represent an important shift in thinking. By expanding the data lake model to include the management of enterprise data at its source, we change the conversation to include data governance in the same breath as data analytics — always.

With this approach, data governance isn’t a “known issue” to be addressed by some and tabled by others; it’s an integral part of the paradigm. And while it may take more work to implement at the outset, the dividends from making the commitment are immense: Data in context.

From hysteria to reality, Risk-Based Transformation (RBT)

Risk based transformation

The digital movement is real. Consumers now possess more content at their fingertips than ever before, and it has impacted how we do business. Companies like Airbnb, Uber and Waze have disrupted typical business models, forcing established players in different industries to find ways to stay relevant in the ever-emerging digital age. This post is not about that. Well, not in the strictest sense.  There are countless articles explaining the value of being digital. On the other hand, there are very few articles about how to get there. Let’s explore how to get there together, through an approach that I have named Risk-Based Transformation. RBT’s strength is that it puts technology, application, information and business into one equation.

An approach that fits your specific needs

I’m relocating very soon, and with that comes the joys of a cross-country journey. Being the planning type, I started plotting my journey. I didn’t really know how to start, so I went to various websites to calculate drive times. I even found one that would give you a suggested route based on a number of inputs. These were great tools but they were not able to account for some of my real struggles, like how far is too far to drive with a 5- and 3-year-old.

Where are the best rest stops where we can “burn” energy — ones that have a playground or a place to run? (After being cooped up in a car for hours, getting exercise is important!) How about family- and pet-friendly places to visit along the way to break up the trip? What about the zig-zag visits we need to make to see family?

The list goes on. So while I was able to use these tools to create a route, it wasn’t one that really addressed any of the questions that were on my mind. Organizations of all sizes and across all industries are on this digital journey but often the map to get there is too broad, too generic, and doesn’t provide a clear path based on your unique needs.

A different approach is needed, one in which you can benefit from the experience of others, whilst taking the uniqueness of your business into account. Like planning a trip, it’s good to use outside views in particular to give that wider industry view; however, that’s only a piece of the puzzle. Each business has its own culture, struggles and goals that bring a unique perspective.

RBT framework

To help with this process, I have created a framework for RBT. At a high level, RBT takes into account your current technology (infrastructure), application footprint, value of the information, and risk to the business. From left to right, the least weight to the highest. This framework gives a sense as to where to where to start and where the smart spend is. See flow below:

Risk-Based Transformation

Following this left to right, you can add or remove evaluation factors to this based on your needs. Each chevron has a particular view, in a vacuum if you will, so the technology is rated based only on itself. It will gain its context as you move through each chevron. This will give you a final score. The higher the score, the higher the risk to the business.

Depending on your circumstances, you can approach it David Letterman style and take your top 10 list of transformation candidates and run it through the next logic flow (watch for a future blog on how to determine treatment methodology). Or, as we did with a client recently, you can start with your top 50 applications. The point is to get to a place that enables you to start making informed next steps that meet your needs and budget to get the most “bang” for your investment.

The idea behind this framework is to use data in the right context to present an informed view. For example, you can build your questionnaires on SharePoint or Slack or another collaboration platform that also allows the creation of dashboard views. You can build dashboards in Excel, Access, MySQL or whatever technology you’re comfortable with in order to build an informed data-driven view, evaluating risk against transformation objectives. The key is that you need to assign values to questions in order to calculate consistent measurements across the board.

Service management example

Let’s take service management as an example. Up front you would need to determine what “good” looks like, and then based on that, have questions like these below answered:

Service Management

These questions could be answered by IT support, application support, business owners, the life cycle management group, or other relevant groups. When we ran through the first iterations of this framework, we had our client fill it out first. Then we filled it out based on our data points. Our data points looked different, as it was an outsourcing client in which we owned their IT. We had the view in a vacuum of what we had both inherited, the equipment from the existing estate that had been transferred to us, and what we had newly built.

We also had access to the systems that the client did not have, as they no longer had root access to these systems. The client’s context included future plans for life cycle, as they owned life cycle management. With those combined views, we had a broader sense of the environment. This methodology could be used with business units, allowing them to give their view of these systems, which gave IT an even more rounded view because it enabled us to see how the client (business) saw their environment versus how we (IT support) saw it.

That data was then normalized to give a joint view for senior leadership. The idea is that this became a jointly owned view, backed up with data, of the way forward that IT leadership could confidently stand behind. The interesting part is although the age of the server estate was 5 – 10 years old, we realized that upgrading the infrastructure was not the smartest place to start. In fact, the actual hardware was determined to be the lowest risk. The highest risk was storage, which was quite a surprise to all.

RiskBased Transformation

A living framework

Many years ago, when you plotted your cross-country drive on your map it was based on information from a fixed time. This was the best route when I drew the line on the map. Now, personal navigation devices hooked into real-time data change that course based on current conditions. In the same way, the RBT model is a living framework; it should have regular iterations in order to have course corrections as you go forward.

The intent with this framework and thinking is to build a context that makes sense for your needs, and then present data in context that allows for better planning. That better planning should lead to a more efficient digital journey as we all continue to stay with, or ahead of, the curve.

If you have enjoyed this, look forward to my next post. There I will detail how the RBT framework is applied and the treatment buckets methodology.

Insurers’ appreciation for orthogonal data

Orthogonal data

It is anticipated that within the next three years, on average every human being on the planet will create about 1.7 megabytes of new information every second. This includes 40,000 Google searches every second, 31 million Facebook messages every minute, and over 400,000 hours of new YouTube videos every day.

At first glance, the importance of this data may not be obvious. But for the insurance industry, tapping into this and other kinds of orthogonal (statistically independent) data is key to finding new ways to create value.

A clearer picture of individual risk

By paying closer attention to the data people create as part of their everyday lives, insurance companies can better anticipate needs, personalize offers, tailor customer experience and streamline claims. Using a wider variety of information is especially useful in better understanding and managing individual risks. For instance, behavior data from sensors, shared through an opt-in customer engagement program, provides insurers with the insight needed to initially assess and price the risk, and mitigate or even prevent subsequent losses.

Take, for example, the use of telematics data from sensors embedded in cars and smartphones. When shared, the raw telemetry data provides insurers with insight into an individual’s actual driving behaviors and patterns. Insurers can reward lower-risk drivers with discounts or rebates while providing education and real-time feedback to help improve the risk profile of higher-risk drivers. Geofencing and other location-based services can further enhance day-to-day customer engagement. In the event of an accident, that same sensor data can be used to initiate an automated FNOL (first notice of loss), initially assess vehicle damage, and digitally recreate and visualize events before, during and after the crash.

Using individual driver behavior to monitor and manage risk is just one way to leverage orthogonal data in insurance. Ultimately, new behavioral and lifestyle data sources have the potential to transform every aspect of the insurance value chain. Forward-looking insurers will tap into these emerging data sources to drive product innovation, deepen customer engagement, improve safety and well-being and even prevent insured losses. For those who invest in the platforms and tools needed to harness the value of orthogonal data, the advantages will be significant.

The Ultimate Data Analysis Cheat Sheet: Tool for App Developers

 Cheat Sheet tool

Analytic insights have proven to be a strong driver of growth in business today, but the technologies and platforms used to develop these insights can be very complex and often require new skillsets. One of the initial steps in developing analytic insights is loading relevant data into your analytics platform. Many enterprises stand up an analytics platform, but don’t realize what it’s going to take to ingest all that data.

Choosing the correct tool to ingest data can be challenging. Anteelo has significant experience in loading data into today’s analytic platforms and we can help you make the right choices. As part of our Analytics Platform Services, anteelo offers a best of breed set of tools to run on top of your analytics platform and we have integrated them to help you get analytic insights as quickly as possible.

To get an idea of what it takes to choose the right data ingestion tool, imagine this scenario: You just had a large Hadoop-based analytics platform turned over to your organization. Eight worker nodes, 64 CPUs, 2,048 GB of RAM, and 40TB of data storage all ready to energize your business with new analytic insights. But before you can begin developing your business-changing analytics, you need to load your data into your new platform.

Keep in mind, we are not talking about just a little data here. Typically, the larger and more detailed your set of data, the more accurate your analytics are. You will need to load transaction and master data such as products, inventory, clients, vendors, transactions, web logs, and an abundance of other data types. This will often come from many different types of data sources such as text files, relational databases, log files, web service APIs, and perhaps even event streams of near real-time data.

You have a few choices here. One is to purchase an ETL (Extract, Transform, Load) software package to help simplify loading your data. Many of the ETL packages popular in Hadoop circles will simplify ingesting data from various data sources. Of course, there are usually significant licensing costs associated with purchasing the software, but for many organizations, this is the right choice.

Cheat Sheet tool for data analytics


Another option is to use the common data ingestion utilities included with today’s Hadoop distributions to load your company’s data. Understanding the various tools and their use can be confusing, so here is a little cheat sheet of the more common ones:

  • Hadoop file system shell copy command – A standard part of Hadoop, it copies simple data files from a local directory into HDFS (Hadoop Distributed File System). It is sometimes used with a file upload utility to provide users the ability to upload data.
  • Sqoop – Transfers data from relational databases to Hadoop in an efficient manner via a JDBC (Java Database Connectivity) connection.
  • Kafka – A high-throughput, low-latency platform for handling real-time data feeds, ensuring no data loss. It is often used as a queueing agent.
  • Flume – A distributed application used to collect, aggregate, and load streaming data such as log files into Hadoop. Flume is sometimes used with Kafka to improve reliability.
  • Storm – A real-time streaming system which can process data as it ingests it, providing real-time analytics, ETL, and other processing of data. (Storm is not included in all Hadoop distributions).
  • Spark Streaming – To a certain extent, this is the new kid on the block. Like Storm, Spark Streaming is a processor for real-time streams of data. It supports Java, Python and Scala programming languages, and can read data from Kafka, Flume, and user-defined data sources.
  • Custom development – Hadoop also supports development of custom data ingestion programs which are often used when connecting to a web service or other programming API to retrieve data.

As you can see, there are many choices for loading your data. Very often the right choice is a combination of different tools and, in any case, there is a high learning curve in ingesting that data and getting it into your system.

Reasons why insurers need AI to combat fraud ahead of time.

AI to combat fraud

The insurance industry consists of more than 7,000 companies that collect more than $1 trillion in premiums annually, providing fraudsters with huge opportunities to commit fraud using a growing number of schemes. Fraudsters are successful too often. According to FBI statistics, the total cost of non-health insurance fraud is estimated at more than $40 billion a year.

Fighting fraud is like aiming at a constantly moving target, since criminals constantly hone and change their strategies. As insurers offer customers additional ways to submit information, fraudsters find a way to exploit new channels, and detecting issues is increasingly challenging because threats and attacks are growing in sophistication. For example, organized crime has found a way to roboclaim insurers that set up electronic claims capabilities.

Advanced technologies such as artificial intelligence (AI) can help insurers keep one step ahead of perpetrators. IBM Watson, for instance, helps insurers fight fraud by learning from and adapting to changing business rules and emerging nefarious activities. Watson can learn on the fly, so insurers don’t have to program in changes to sufficiently protect against evolving fraud at all times.

insurers need Artificial Intelligence to combat fraud

Here are four compelling reasons insurers need to begin to address fraud with sophisticated AI systems and machine learning that can continuously monitor claims for fraud potential:

  1. The aging workforce. There are many claims folks who are aging out and will soon retire, taking years of knowledge with them. Seasoned adjusters often rely on their gut instinct to detect fraud, knowing which claims just don’t seem right, based on years of experience. However, incoming claims staff don’t have the experience to know when a claim seems suspicious. Insurers need to seize and convert that knowledge, getting it into a software program or an AI program so that the technology can capture the experience.
  2. Evolving fraud events and tactics. Even though claims people may have looked at fraud the same way for years, the environment surrounding claims is always changing, enabling new ways to commit fraud. Fraud detection tactics that may have worked 6 months ago might not be relevant today. For instance, several years ago when gas prices were through the roof, SUVs were reported stolen at an alarming rate. They weren’t really stolen however — they had just become too costly to operate. Now that gas prices have gone down, this fraud isn’t happening as often. If an insurer programs an expensive rule into the system, 6 months later economic factors may change and that problem may not be an issue anymore.
  3. Digital transformation. Insurers are all striving to go digital and electronic. As they make claims reporting easier, more people are reporting claims electronically, stressing the systems. At the same time, claims staffing levels remain constant, so the same number of workers now have to detect fraud in a much higher claims volume.
  4. Fighting fraud is not the claim handlers’ core job responsibility. The claim adjuster’s job is to adjudicate a claim, get it settled and make the customer happy. Finding fraud puts adjusters in an adversarial situation. Some are uncomfortable with looking for fraud because they don’t like conflict. A system that detects fraud enables adjusters to focus on their areas of expertise.

In the past, insurance organizations relied heavily on their experienced claims adjusters to identify potentially fraudulent claims. But since fraudsters are turning to technology to commit crimes against insurance companies, carriers need to turn to technology to help fight them. Humans will still be a critical component of any fraud detection strategy, however. Today, insurance organizations need a collaborative human-machine approach, since they can’t successfully fight fraud with just one tactic or one system. To fight fraud, humans need machines, and machines need human intervention

Here’s how regulatory intelligence aids strategic decision-making in real time

regulatory intelligence

Data is all around us. It’s created with everything we do. For the life sciences industry, this means data is being collected faster and at a greater rate than ever before. Data takes the form of structured content — from clinical trials, regulatory filings, manufacturing and marketing, drug interactions and real-world evidence — with regard to how drugs are used in healthcare settings. It also is found in unstructured content from the internet of things (IoT), such as social media forums, blogs and so on.

But having massive quantities of data is useless without the regulatory intelligence to make sense of it. Let’s define what we mean by regulatory intelligence. This is about taking multiple data sources and feeding those into a regulatory system that can look at the data, analyze it, make use of it, collect information from it, then take that information to distribute it where it needs to go. This might be to the regulatory agencies requesting updates or information about the drug portfolio to satisfy compliance mandates, it might be to partners that you’re working with, such as trading partners, or it might be consumed internally.

Although referred to as regulatory intelligence, it encompasses many other areas of the product life cycle, including clinical research and development for detailed analysis and safety and pharmacovigilance for signal detection.

Life sciences companies can leverage these different types of data for real-time decision making to protect public safety, respond to supply shortages, protect the brand, advance the brand — for example, into new indications or new markets — and for many other purposes. In this blog, I’ll explore some of these uses of regulatory intelligence in greater depth.

Know your target

Since data is consumed across the life sciences in different ways by different people and different functions, getting to the point of intelligence first requires knowing the target and objective. If there is real-world data indicating adverse events that weren’t detected in clinical trials, having that intelligence early on allows companies to act accordingly — both to protect public safety and to safeguard brand reputation. What action the company takes will depend on what the data shows, as well as what the agencies require. For example, it might simply be to reinforce a message about avoiding other medications or foods while undergoing a specific treatment or it might require a broader response.

Another way data can be leveraged for real-time strategic decision making is to advance the brand. For example, IoT data or data held by the authorities might show weakness in a competitor’s product or weakness in the market — perhaps a gap in a region the company has begun targeting. By leveraging that intelligence, companies can take advantage of those gaps or competitor weaknesses and promote their brand as a better alternative or prepare a new market launch.

Regulatory intelligence might also shine light on other potential indications for your product. These insights might be gathered from IoT sources, such as physician blogs, or from positive side effects observed in clinical trials. The most famous example is Viagra, which initially was studied as a drug to lower blood pressure. As was the case here, not all side effects are negative, and during clinical studies an unexpected side effect led to the drug’s being studied and ultimately approved for erectile dysfunction. Having that regulatory intelligence available gives you the leverage to make the case for expanding clinical studies into new indications and extending therapeutic use.

Adding Real-Time Intelligence

From data to intelligence

Now that we have explored the definition of and some purposes for regulatory intelligence, we should also look at how you get from that point of data to intelligence. An important first step is to deploy the right analytical tool to sift through that data and pull out relevant information. It’s equally important to know how to make use of that data, and that requires knowing your end goal and narrowing the scope of your data search to eliminate extraneous data.

Time and resources can also be saved by leveraging automation to collect data for analysis. Since data is continuously being created, updated and pushed out, automated robotic processes make it possible to keep up to date with the latest findings and pull relevant data into your regulatory operational environment.

Regulatory intelligence is the key to real-time strategic decision making across all areas of research and development. Its importance to the organization can’t be overstated.

error: Content is protected !!